1.Introduction
Do you want to be able to do detailed structural geology and target minerals, in plan and section, straight from magnetic images?? This paper shows you how to do it in the Stawell gold mining area.
**Note 1. This paper has been completed using the voice to text function on my IPhone. It is a great system and the verbiage for this paper was completed in two early morning sessions, when I am most coherent! Although the language is colloquial this can make it understandable to a greater range of people who may be interested in the often quite difficult areas that I research. So, all of you who like to read academese – sorry 😊. **
** Note 2. This paper ended up growing and will be split up into 4 sections to make it more digestible!?? **
I’ve spent 45 years examining the Earth and Moon and Venus at the large-scale.
Many geologists have said large scale is very interesting but how about something we can use on a local targeting scale – well here is the first.
Now that I’ve proved the structures on my images are very real on the large scale, I’m now starting to do some work at the pointy Project Scale Exploration Targeting end.
I’m going to examine various mining projects at a small exploration targeting scale. I will be doing this through using any publicly available data that I can enhance. This includes magnetics, Landsat, gravity EM, seismic tomography, geochemistry, muon tomography – any data source.
In this research I will now be looking at the Stawell region where I worked for six years and did my MSc on the mineralisation of the Magdala and Wonga mines. I have published my findings in Watchorn MSc 1987, Watchorn, Wilson and Quick, 1987, Watchorn et al 1988, Wilson and Watchorn, 1988, Watchorn and Wilson, 1988, Watchorn and Wilson, 1989. I thus know the regional and local structures intimately and so will be able to recognise if the structures I observe in my images are real or not.
Stawell is like Western Australia, all undercover, but I have been able to define the Magdala and the very high-grade flat reef structures and structures using enhanced magnetics. I can do this in plan and section – even down to the mine scale.
For example, the Stawell mine section was from a 3D magnetic inversion model on Magdala, Section Line 254. I didn’t realise that these 3D magnetic inversion models, when enhanced, produce accurate (but cluttered) images of the structural geology and lithology!! I’m pretty sure no-one else has achieved this?? If they have can someone give me the URL reference and we can compare notes and advance much faster! This is still early stage research and like a good wine will improve with time!
I even got good structural geology and lithology from a vectorised Arsenic geochemical data image – but that can wait until later.
1.Stawell regional research
Stawell is the westernmost goldfield in Victoria.

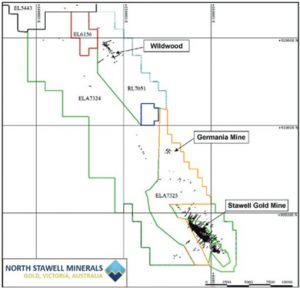
This figure from North Stawell Minerals shows their leasehold north of Stawell with the main projects outlined. This paper will be focusing on the Stawell Gold Mines area in the south east corner of the plan.
This figure (from Korsch et al 2002) shows the regional geology of the Stawell area and the seismic line 97 AGS V2 which we will enhance. The general trend of the geology is NNW and the Stawell area sits on the junction of the Ordovician Lachlan (east) and Cambrian Delamerian (west) Orogenies.
3.Research of seismic cross section 97 AGS V2
This figure (from Korsch et al 2002) shows the seismic line 97 AGS V2, the original seismic traverse was done in 1997 across the Central Stawell region. I will be using my EagleEye enhancement method to highlight the structural geology in this section.
This image is not enhanced but still shows some structural detail.
The bottom inset in this plan is the original interpretation of the Stawell and Concongella faults in the region. It can be seen that there is a great difficulty in interpreting decent structures in the original image. These faults are quite clear but different in my enhancement below.
This is my EagleEye enhanced plan in which major structures can be seen. In many of my research papers I have proved that these structures are real. There is no reason to believe that they are not real in this seismic section.
On the left-hand side of the section the large Stawell syncline can be seen. The yellow dotted line corresponds fairly well with the Stawell Syncline 20 km south. The orange line in the lower insert is an approximate top surface of what looks like Cambrian basalt basement.
The section crosses roughly where the Wildwood project is located. The top of the orange line in the centre left of the section correlates with the basalt dome at Wildwood.
The red outline has the appearance of the top of a granite bathylith. Stawell Fault (blue) shows in this image as a steep fault rather than a shallow fault as was in the original interpretation. Likewise, the Concongella fault shows as a steep zone rather than a shallow dipping zone.
Large ramp structures (blue) on the left-hand side of the plan correlate with the Moyston Fault line which is supposedly the junction of the Ordovician in the East with the Cambrian in the west.
This figure shows the interpretations on the enhanced seismic section. To observe the structures toggle between the two figures.
The conclusion is that good structural geology, that correlates with known structures, is obtained using EagleEye enhancement of the seismic section. The next task is to come down to the Stawell mine scale and see what structures are observed.
