4.Stawell Gold Mines history, production and geology.
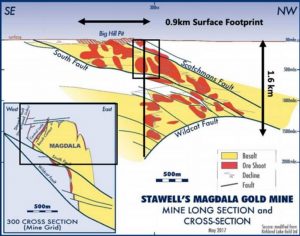
This figure shows cross-section 300 and a longitudinal projection of the Magdala mine in 2017. The ore was mined down to 1600 metres depth but still had an intersection of 2 m at 13g/t down at 2300 m when it closed. The mine has now reopened and is mining in the upper levels on the eastern side of the Magdala anticline.
The Stawell field produced over 2,700,000 ounces from 1853 to 1926. The mine produced approximately 2,220,000 ounces from 1984 to 2017. So, the total recorded production (less stolen gold) is 4.92 million ounces – a large, high grade field.
The figure shows the 25° and 70° north plunge to the Magdala orebodies with the Golden Gift orebodies in the centre having a 70° north and vertical plunge. These plunges will be the result of cross structures which should be visible on the enhanced plans.
The inset on the left-hand side shows a cross-section from the surface to 2000 m depth through the Magdala mine on 300 cross section. The following magnetics cross sections only extend to 600 m depth as is shown by the black boxes on the cross section and longitudinal projection.
The basalt core (yellow) can be seen with East dipping North plunging faults moving the top blocks to the west (cross section) and south (longitudinal section).
These are the main structures I will be looking for in the plans and sections that have been enhanced.
5.Research of the Magnetics of the Stawell area
This figure shows the TMI magnetics (left) and Bouguer gravity (right) of the Stawell region (Smith and Frankcombe, 2006. P772).
This figure shows the TMI magnetics of the Stawell area. South Fault, Stawell Fault and Coongee Fault are shown. They are traced onto the next series of images (blue lines) to give a structural framework from this available research.
6.Stawell locality enhancement of magnetics
The left-hand inset shows the Magnetics from the Stawell granite through the Magdala dome with the Magdala mine workings. Right-hand inset shows the Bouguer gravity in the same area.
These figures show the EagleEye enhancement of the magnetics in the previous figure. Many structures are seen, in particular NNE and WNW structures.
Stawell granite is seen in the bottom of the image. Interestingly the gravity image gives us more definition along its contact with the sediment. Gravity might be a better exploration tool around granites?
This shows the structures from the regional magnetics and how they relate to the underground Magdala and Golden Gift mine workings. These workings appear to be bracketed by the Stawell Fault to the NNW and South Fault and associated faults to the WNW. Internal shoots appear to be associated with ENE structures.
This enhancement was to highlight the basalt dome and sedimentary structures trending to the NNW.
Large circular structures may be fractures relating to up-welling granites as they have the same appearance as the Stawell granite. The Black Range Granite correlates with the left-hand circular structures. If these do relate to granites then these ultra-enhanced plans are a great tool for targeting granites that may relate to granite and porphyry hosted, bulk mining orebodies.
The signature of the granite looking magnetics on the right-hand side relates to more gently folded sandstone in the surface geology, if I remember. However, it may be underlain by basalt or granite at a shallow depth as it is the wrong signature for folded sandstone??
I have deliberately refrained from any detailed interpretation as I’m sure all interested geologists and Geophysicists will want to do that themselves. Especially those with the most to gain, those redblooded geologists working for Stawell Gold Mines :)!
This enhancement was done to highlight the domal and sedimentary structures trending to the NNW.
Large circular structures are seen all over the plan (they are so clear I haven’t interpreted them). These may fractures relating to up-welling granites as they have the same appearance as the Stawell granite.
The relationship of the mine ore-shoot structure appears to correlate strongly with the ENE direction which in the magnetics is very strong through the mine area and to the WNW.
There is also there is a fuzzy, but very strong, EW structure that bisects the Magdala mine (light blue line). It is more evident, and sharper, on the previous gravity figure. These EW structures feature strongly in all big minefields I have researched. They are a good regional and local targeting tool.
In the next part we will be looking at the 4.5 million ounce Magdala, Golden Gift and Scotchmans Cross flat-vertical lodes and how to target them —– just using regional magnetics.
7. Magdala and Flat-Vertical mines’ structural geology
In this coming section we will be looking at a more local mine scale to correlate known structures, from mine exploration, to those on the enhanced magnetic plans.
Share this with your colleagues!!! You might find the next Stawell!!
