7.Magdala and Flat-Vertical mines’ structural geology.
In this section we will be looking at a more local mine scale to correlate known structures, from mine exploration, to those on the enhanced magnetic plans.
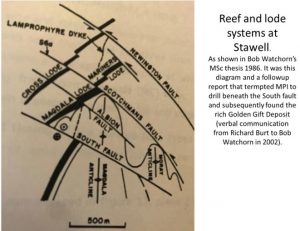
This figure is from the Watchorn 1986 MSc thesis. This and other figures prompted the exploration for the Golden Gift ore bodies which gave Stawell Gold mines a further 18 years life and it is still operating!
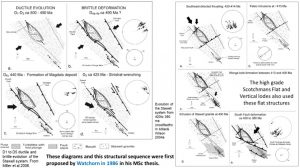
Structural sequence of the Magdala and Wonga mines (from Watchorn 1986, Miller and Wilson 2004a, Miller et al 2006). The above structures should be observed on the plans and sections and their direction, overprinting relationship and sharpness give an indication of their geochronology.
8.Mine-scale cross section enhancement of magnetics on mine section 300 Magdala Mine
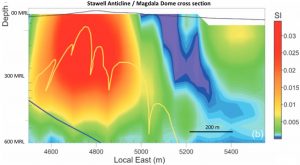
This figure shows a 3D magnetic inversion section through section 254 of the Magdala mine (Smith and Frankcombe 2006). The yellow line shows the drilled Magdala dome with sediments above and basalt below. Warm colours are conductive and /or magnetic.
Interpreted geology is overlain with basalt (yellow), and ground surface (black). The blue line in the bottom left is South Fault.
We will be trying to see thise well drilled out lithology and structures in the EagleEye enhanced images.
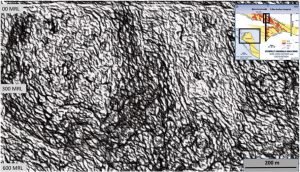
This is early days for enhancing the Stawell area but already structures and lithologies are observed that relate to mapped and drilled reality.
This enhanced image, while it looks very cluttered, actually shows a lot of structure. The flat East dipping structures correlate with South Fault.
Steep East dipping ribbon like structures correlate with East Limb Fault and the Stawell Fault.
The basalt shows as more solid lithology (white patches) in the central left area. The top of the image shows as domal structures (upward darker arcs) between the more solid lithologies underneath and the blander but more finally structured sediments above. This is exactly what the drilling shows.
In the bottom left of the image it can be seen that the basalt has moved to the left (eastward) under South Fault.
This is a really first pass image and with further refinement would show a lot more clearly the lithologies and fault structures. Even so, this is the first time, as far as I know, that ultra-detailed geological structure has been gained from a 3D magnetic inversion section.
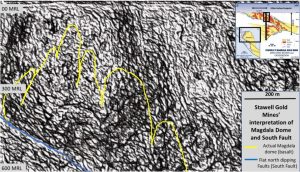
This section has the Magdalena dome superimposed on it. One feature that stands out is the more solid looking lithology between the two limbs of the Dome above South fault. This is clearly the basalt. Also, there is a shadow of darker lineated features on the east side of the dome. This equates to the eastern limb volcanogenic sediments. Parasitic folding is seen in the top centre right which correlates with the east limb vergence of the Magdala dome.
The top right insert shows the area of the section (boxes) in section and in longitudinal projection.
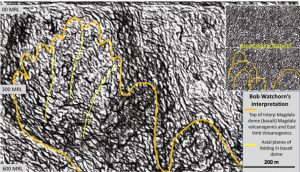
This figure shows my interpretation of the Magdala dome including the west limb Magdala volcanogenics and the east limb volcanogenics.
Some vertical wavy lines are seen which correlate with the Magdala basalt domes. These may be axial plane faults that are related to the Magdala Dome.
The top right inserts show more clearly the domal structures. Cluttered structures are often seen better at a smaller scale.
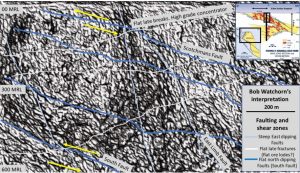
This is an interpretation of the flatter structures seen on the section. The flat East dipping structures (blue) relate to South Fault and are sinistral in movement.
The flat West dipping structures (white) appear to be later. They may be late fractures related to the high-grade Cross and Scotchmans Reefs and the Wonga mine.
Late thin, but high-grade, ore with arsenopyrite was mined in the Magdala lode and was associated with these flat fractures (Watchorn 1987).
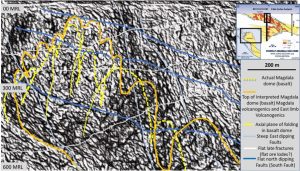
This figure shows all of the above interpretations as well as the East Limb Fault (light blue) which appears to be a boundary between a more sedimentary (finer lineated) domain to the east and the volcanogenic/basalt (more blocky) domain to the west.
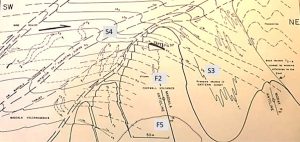
This diagram, from Watchorn 1986 MSc, shows the early deformations D1 to D3 and also shows the D4 shears and D5 folding. I would expect the ultra-enhanced image to look like this plan if my current enhancement and the structural geology I did 35 years ago are correct.
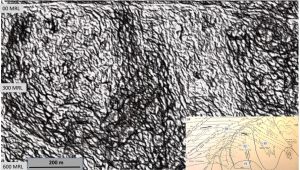
Both plans have a remarkable correlation, even down to the crenulations caused by the thrusting of S4 on S3!
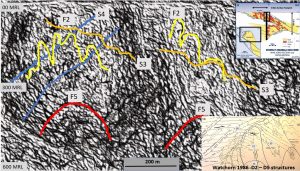
This image shows the interpreted D2 – D5 structures shown in the 1986 Watchorn MSc.
My structural geology from 35 years ago has proved to be manifestly correct by the many subsequent geological studies done on the Stawell mine. This confirms again the validity of the structures seen in my EagleEye ultra-enhanced images – even at mine scale. This then confirms their usefulness in exploration targeting.
If you’re arguing about the validity of these structures, you’re in highly qualified company – ho ho!
I remember the interesting (argumentative – in a nice way) time I had convincing Professor Chris Wilson (my MSc supervisor) in early 1982 that there were 8 deformations affecting the Stawell mine. Chris adhered to the 3-deformation regime current in Victoria and most of Australia in the early 1980s.
It was only when I took him underground and showed him the early D1 – D3 structures up close and in great detail that he, at first reluctantly, admitted I may be correct. My 8 deformations were the result of many spirited discussions with Dr Pat MacGeehan an extremely observant, paradigm changing genius fellow WMC colleague.
Note to observe**
I left my PhD program at UWA 4 years ago because I could not convince those that guide the research there of the validity of my enhancement method and where it would lead to. It will be instructive to see if the presentation of this small-scale enhancement and my continental scale evidence persuades these well qualified people of the validity of my structural geology work. It does feel like 1982 all over again.
Meanwhile, those on the ground, pragmatic geologists interested in finding orebodies have thoroughly endorsed this structural geology exploration targeting research – I think that says something 😊?
The next section will be mine scale enhancement of the immediate Magdala mine. Can we see the flat/vertical and Magdala lodes in plan???
You’ll have to wait!

