Objectives of this mine focused research.
This post shows what additional enhancement can be achieved on the new Radio Image Mapping (RIM) technology used at Rosebery Mine, Tasmania. The RIM technique was used by Nordic Geoscience and is described in Figure 1 below. I saw the post on LinkedIn by Asbjorn Christensen https://www.linkedin.com/in/asbj%C3%B8rn-n%C3%B8rlund-christensen-nordic-geoscience/ and as the technique was similar to seismic tomographic surveying I reasoned that verifiable structures should be visible using my ‘EagleEye’ methodology.
The original RIM image is fuzzy but has well defined colour ‘structure’. If my ‘structures and proposed lithologies’ can be verified by further drilling within this section then this will be huge leap forward for exploration targeting using remote sensing techniques.
Verification of EagleEye structures and their use in mine mapping and exploration targeting.
I have enhanced numerous mine images and obtained what I think are real structures. One was at the Stawell mine where I did my structural geology Masters Degree through Melbourne University. I defined structures that corresponded exactly with those seen in the mine which were only outlined years after my research. See this post on this later research on my website https://www.geotreks.com.au/work/projects-studies/stawell-gold-mining-area-mine-scale-exploration-targeting-using-eagleeye-enhancement-of-magnetics-in-plan-and-300-magdala-cross-section/ .
We won’t know if my structures are real at Rosebery until the core is checked for my structures and a further hole is drilled between them on the section which I believe is to be done. However the results look plausible to me as a mine exploration geologist, and I hope they will be used by the mine exploration geologists to unravel the structure and find more ore!
The following figure shows the original data used.
The figure is self explanatory. The pattern indicated the highly transmissive areas (red) which are believed to relate to the sulphide orebodies.
There are no detailed structures shown. It is my experience over 53 years that these, supposedly syngenetic, orebodies are concentrated (or otherwise) by overprinting, later structures. So, it is my aim to outline in detail these surrounding structures and try to get some relative timing.
Exploration efforts will be enhanced and focused if this EagleEye detailed structural data is used on MMGs 13 sections and is put into a 3D model .
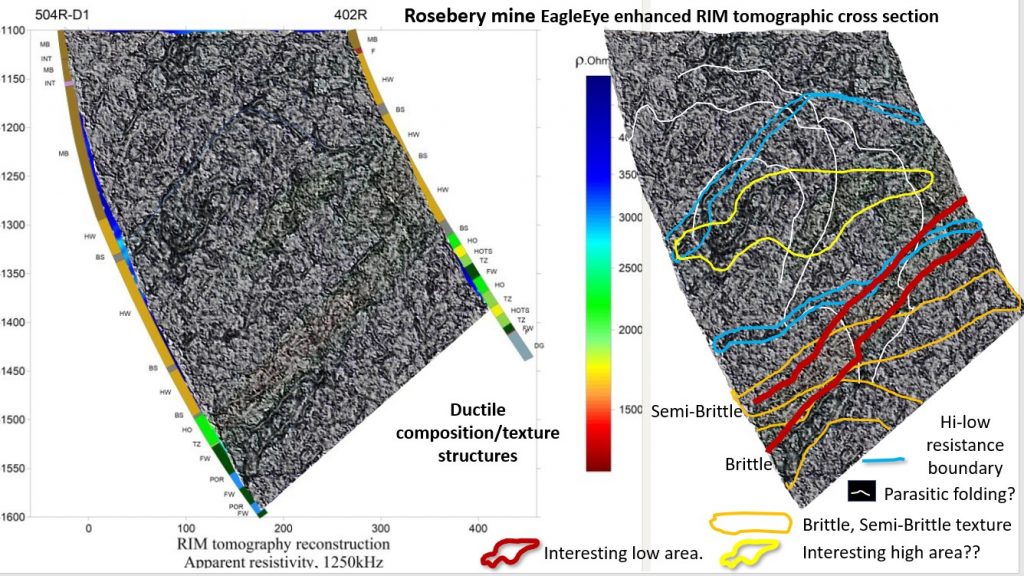
Figure 2 shows the enhanced data.
This figure shows the detailed data which has been enhanced to show more brittle faults and shearing features. It is seen that the high transmissive zone (dark blue) is more sheared than the surrounding area. This zone is cut by a vertical set of strong ‘cleavage type’ structures (mid blue) and a set of flat joints (light blue). The intersection of these later structures may enhance the ore grade?
This data shows stronger linear structures and textured domains that possibly represent different lithologies or episodes of tectonic deformation.
Below is a description of the structures and their relative timing.
1. The high transmissive area shows up as yellow/red (red). If this is a potential ore zone it is very fractured but not displaced too much. The flat fractures (orange) appear to displace the high transmissive area on the lower side (sinistral) suggesting they are later than the ‘ore’.
2. There is an arc of fragmented linear structures (white) that may outline part of a fold set?
3. There are late, flat, more brittle areas (orange) which may be areas of dykes or alteration.
4. There are two strong sets of very late fractures which don’t displace anything. Late fold axis faults??. One set dips in line with the drill holes and the other is a possible fold axis fault to the parasitic fold (white).
I will be interested to see what the structural sequence is at Rosebery as I know little about the mine.
This figure highlights domains that most likely represent rock composition variation.
The more obvious is a half ‘rosette’ shape (white) which most likely is a parasitic fold (maybe only of the structural fold variety) as it is the right shape. It may show up in the enhancement because of alteration in the nose of the fold?
The yellow outlined area in the nose of the fold shows the strongest variation in transmissivity. Thia may be of interest? It certainly would be of interest for late stage hydrothermal deposits?
The blue outlined areas of higher transmissivity may be black shales as they line up with the black shales in the drill holes. If this can be verified then they will make excellent mapping markers.
Conclusions.
This was a fun exercise 🙂
These enhanced structures, if proved reliable, will be of great assistance in mine mapping and exploration. It is hoped that the MMG mine geologists have enough experience to be able to unravel the structures indicated and drill the intermediate hole to check their veracity. If they do this then they will have a very powerful tool for exploration targeting.
If this research helps us find our next deposits I would be delighted. Share it with your colleagues.
Cheers
Bob

