Colour contouring, as shown below, as a method of defining lithology doesn’t work! Structural geology and lithology texture does work! Find out why!
The AusIMM webinar I did on this new research can be seen on the AusIMM website or on https://www.youtube.com/watch?v=snu8En442Js
It is preferable to listen to the above webinar before delving into these posts!

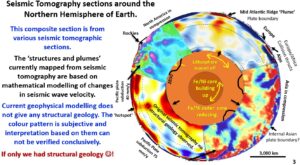
This figure shows the seismic tomography around the northern hemisphere of Earth. The colours shown are obtained from seismic tomography based on mathematical modelling of relative changes in seismic tomography wave velocity.
However, current geophysical modelling does not give any structural geology or texture. The colour pattern is subjective and interpretations based on them cannot be verified conclusively by structural geology. What looks like an orange plume in one area is red or green in another area’s colour scheme. Subjective! It is not factual over Earth-Scale areas!
Structural geology and texture that is visible is factual. If you can see major well known structures, like the Mid-Atlantic Ridge and the Great African Rift on my EagleEye sections, and they correlate with the actual position of these structures, then by most standards they would be classified as fact. This is important to bear in mind as we go through the webinar. I will be highlighting these fact structures soon.
Important Note. 3D modelling of seismic tomography as currently practised is incorrect!

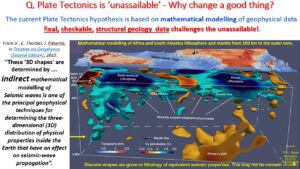
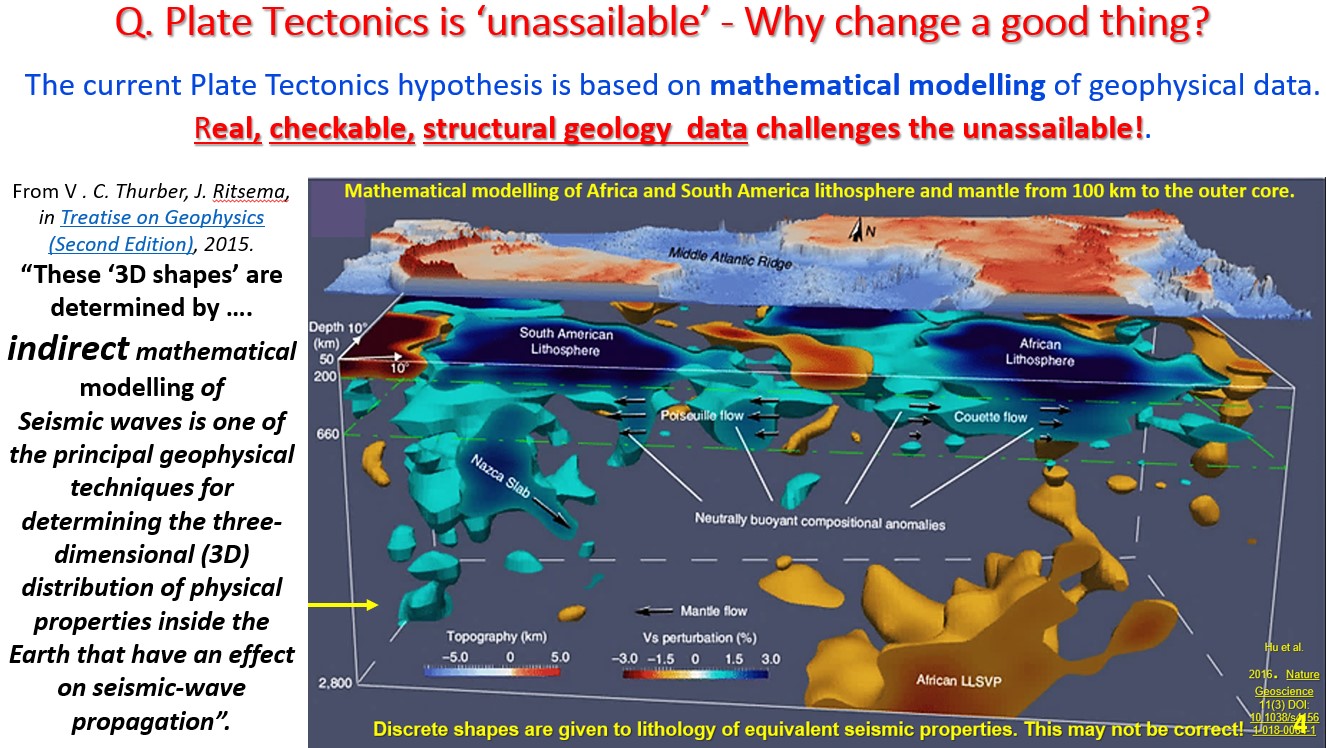
The current plate tectonics hypothesis is based on mathematical modelling of seismic data.
These 3-D shapes are determined by indirect, mathematical modelling of seismic waves and this is one of the principal geophysical techniques for estimation of the 3D distribution of physical properties inside the Earth that influence seismic wave propagation (Thurber and Ritsema 2015).
The property of the seismic waves that is modeled is the wave velocity. The modelling is done based on this one property. However, within each lithology the variables are temperature, hardness, pressure, wetness, and others. However, the different colours are classified (and 3D domained) as different lithologies in the current system. Wrong?
The above 3D shapes enclose lithologies of vastly different geology and the boundaries are often not related to actual lithology. As we shall see later under both North and South America, lithologies with the same structure and texture, but completely different colours, can exist either side of a major fault suggesting that one side maybe hotter or wetter, but not that there is a ‘plume’ there.
There is no structural geology or lithology ‘texture’ involved in obtaining the 3D shapes by the mathematical modelling method. The structure and texture have been recorded by the seismic tomography but current geophysical methods cannot define them, EagleEye can!
If this data was treated as an medical MRI scan, then that software would give even better results than EagleEye.
So, why don’t geophysicists obtain the pattern recognition software used in MRI scans, adapt it, and then get decent results from their data? I use pattern recognition and definition software from Microsoft, it is clunky but does work!
Let me say that there is nothing wrong with the mathematical modelling method, as that is the base data I use in EagleEye. It is the lack of further processing by industry recognised pattern recognition and definition software by geoscientists that has been my concern for the last 25 years.
Why is there such colossal inertia in the geoscience industry?? The industry spends billions of dollars a year obtaining fantastic data and then only does basic processing on it?? Make sense?
In Part 4 I’ll show you some of my 1998 structural geology from Yilgarn gravity data that started my on this research – 25 years ago!
Cheers
Bob

