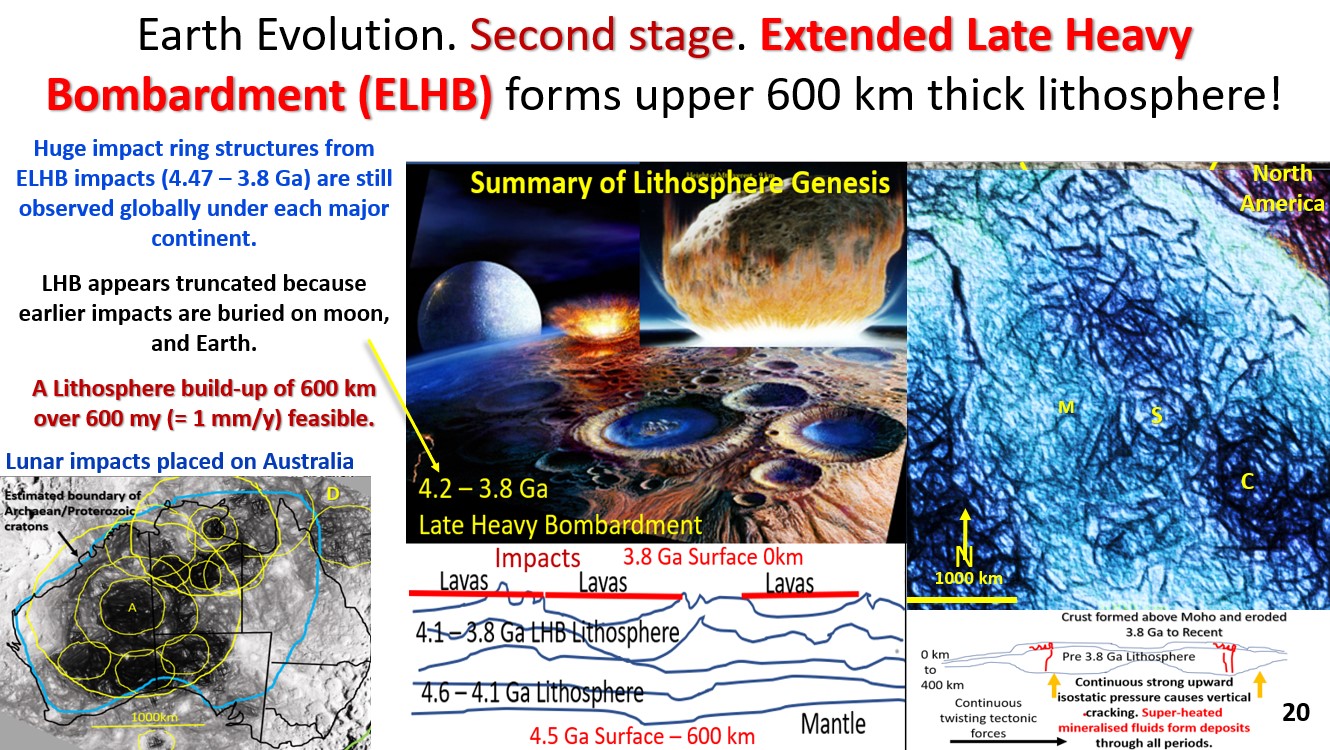
Figure 1. Earth Evolution second stage, Extended Late Heavy Bombardment forms upper 600 km of Earth.
This paper is a reply to a LinkedIn comment on 21/04/23.
….. What I will say though is that, even aside from the methods used, the argument of relict impact craters on earth cannot be independently validated without re-writing everything we know about plate tectonics. And to do so requires initial acceptance of these relict impact structures.
Do you see how this creates a circular and unprovable model? It’s like saying ‘leprechauns exist, but you can only observe them if they touch you on the shoulder’. Each clause is required to validate the other. It’s unprovable.
Discussion.
Now there is a nice challenge!
I will focus on the Plate Tectonics side of the comment more than the impact structures as Plate Tectonics is the problem alluded to – without re-writing everything we know about plate tectonics.
The … to do so requires initial acceptance of these relict impact structures section … will be answered. If the better-known major, near surface, Earth structures (including well known impact structures) can be shown to be modeled correctly by EagleEye then it is unreasonable to assert that numerous, deep seated ring structures which are observed every-where down to about 600 km depth should be disbelieved. Ring structures seen on the above image (figure 1) relate to known impact structures. Thus, both doubts expressed in the above comment will be answered.
The last post on my website linking all this evidence came out after the above comment and it requires quite a bit of time to go through. https://www.geotreks.com.au/work/projects-studies/earth-evolution-summary-links-to-webinar-and-posts-1-to-16/ .
Geoscientists’ time is in short supply thus this post summarises the evidence of many proved structures that have been outlined and verified by my EagleEye system. There is minimal text (after this) and the images can be flicked through quite quickly and you can make up your mind if the structures are real or not. Calculate the probability that I could have fluked all of these correlating structures in plan, section and on different databases!
So, as the comment states, it gets back to the old conundrum of whether the EagleEye earth structures can be; validated, believed, verified, proven …
These structures have been covered extensively in many posts and Webinars over 10 years but it is probably a good time to again summarise a few of the main ones.
This will take (as is usual for me) the form of a series of figures showing the initial image before EagleEye treatment and then the final Eagle Eye image for comparison. A short note will follow the image for clarification.
It is important to note that the EagleEye system obtains structure from bland, non-structural, colour contoured images. This is the unique feature of EagleEye images I have not seen in other image enhancement systems. This will be seen in most of the following EagleEye images.
EagleEye uses proprietary pattern recognition, texture recognition and definition software, mainly by Microsoft and Photoshop.
I did not write the algorithms (just use them) and knowing those companies it would be difficult to get them. However, they work!
Back to the thrust of the comment!
The Plate Tectonics assumptions are;
- The Plates are relatively thin, accreted crust and lithosphere ‘floating’ on a constantly replaced mobile mantle.
- The mobile mantle exists between the Outer Core and the upper lithosphere/crust. This mobile mantle cuts off the base of the lithosphere and transports this material deep into the earth at the subduction zones.
- Lava-like Plumes to do the heavy lifting of this subducted material from the base of the mantle back to the surface, similar to a conveyor.
- Shallow-depth Plate Margins (except for the subduction zones) are required for this Plate Tectonics system to work. If the internal plate boundaries are found to go to the Outer Core, then by default they cut right through and invalidate the mobile part of the ‘mobile mantle.’
In this post I am not trying to disprove Plate Tectonics, as I believe the movement seen at the surface is correct. However, if my structural observations can be validated the mechanism of Plate Tectonics is invalid (just the Plate part of it).
What needs to be proved to test if Plate Tectonics is valid or not?
If the EagleEye images represent known structures then;
- If there are global brittle structures from the surface to the Outer Core. If they are abundant and very persistent and cut through where the Mobile Mantle and the Plumes are supposed to occurr they invalidate points 1, 2 and 3 above.
- If all the internal Plate Margins observed are subvertical structures extending from the surface to the core and cut through the Mobile Mantle this invalidates the ‘mobile’ part of the Mobile mantle.
- If many of the largest continental blocks are structurally brittle to the core they must move by Block movement, not surface Plate movement.
Priority!! Are the EagleEye structures real? A paradigm changing hypothesis needs paradigm changing structures to be believable.
Examination of EagleEye structures around the world.
A. Rifts, Plate margins, subduction, and collision zones.
African rift structure to 800 km depth. Bowl/ring structures suggest huge impacts to 600 km depth. Double Fault correlation in plan and section.
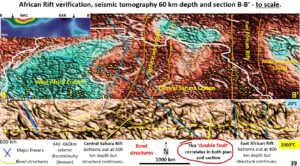
This plan and section structural detail is gained from continental scale seismic tomographic colour contour images (see top-left inset section B-B’). There are no other published images that show this detailed structural geology derived from colour contour images. This applies in all the following images.
You are viewing a first! That is why it is difficult to get a ‘peer’ review based on like data!
The African Rift (left) extends down to 800 km depth. This is supposed to be in the mobile mantle? However, the African Rift structure is clearly observed correlating with its surface position, validating the EagleEye system.
Faults correlate in plan and section, Down-warps line up with rings in the plan (suggesting bowl – impact – structures) down to 600 km depth, hence my assertion that the Early Bombardment of Earth extended to this depth (see figure 1).
The well documented 660 km deep seismic discontinuity is also well outlined.
The observation of these well documented African structures is validation of EagleEye structures down to 800 km depth. Can we see deeper?
African rift structure to the Outer Core (2,850 km depth) on seismic tomographic section.
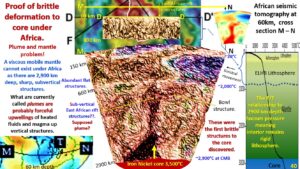
This structural detail is gained from continental scale seismic tomographic colour contour section (small top-right inset).
The African Rift structure that is validated in the near surface section (figure 2) extends to the Outer Core. Thus, there is strong evidence that this deep rift structure is valid as well. The plethora of brittle structures from the core to the surface invalidates the mobile mantle under Africa.
The dark area above the Outer Core is postulated as a major Plume extending to about 600 km from the surface. Many steep and flat structures cut this plume suggesting there is not a lava type plume under Africa.
We will now look further afield!
Africa/South America separation and correlation either side of the Mid Atlantic Ridge from a global seismic tomographic plan at 60 km depth.
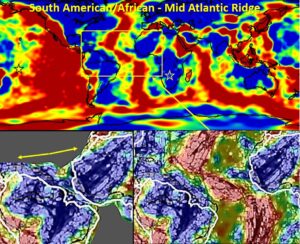
The well documented continental drift hypothesis of the separation of Africa and South America is validated by the matching EagleEye geological structures either side of the Mid Atlantic Ridge (lower right).
However, the geology matches best if the two continents only met at the outer point of West Africa (lower left). This EagleEye structural detail is gained from an enlargement of a section (yellow box) of the 60 km depth global seismic tomographic colour contour plan (top inset).
What does the Mid Atlantic Ridge look like in the northern hemisphere?
The Mid Atlantic Ridge (centre), the Pacific/North American subduction zone (left) and the eastern African/Eurasian plate collision zone with Alp’s nappe structure (right). Landsat plan and seismic tomographic sections.
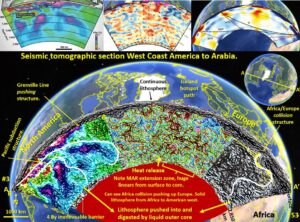
This figure shows the Mid Atlantic Ridge (centre) has subvertical structures from the surface to the core. The African/Eurasian collision zone (right) extends from the surface to the core. These through-going structures invalidate the mobile mantle.
The Pacific plate/North America subduction zone (left) flows flatly down from the surface to the Outer Core. Strong structures cutting it suggest that the movement is like a glacier and moves slow enough that structures can propagate through from the core to the surface.
This is the first time that detailed structural geology has been seen from the Pacific Ocean to Arabia from the surface to the core.
The original images that were enhanced by EagleEye are the contour seismic tomographic sections at the top.
Heading eastward to check the structural geology of the Africa/Europe collision!
Africa/Eurasia plate collision zone Western Zone correlation between Landsat linear structures on plan and a seismic tomographic section.
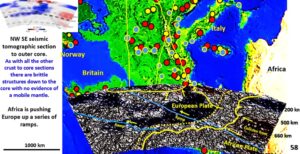
This figure shows the African/Europe collision Zone 9yellow line) down to 1000 km depth. The original colour contour seismic tomographic section is top left.
Europe rides up over the African plate. Strong brittle structures crossing the Landsat plan of Europe extend, with a northern dip, strongly down to 1,000 km depth. Once again this is supposed to be in the territory of the mobile mantle??
Does this correlating evidence add to the validity of EagleEye structures?
We will now examine the Eurasian plate from Spain to the Pacific Ocean east of Japan.
African/Eurasian Collision zone, Pacific/Asia plate subduction zone and central Asian plate incipient rift structures in seismic tomography section.
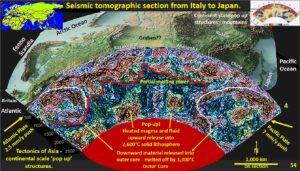
Will now look at the seismic tomography section extending from Spain right across through Russia to Japan and out into the Pacific Ocean.
I have seen very little published research covering this huge area as a single entity. As far as I have been able to ascertain the detailed structural geology beneath Europe, Russia to Japan down to the core is not known. So here is a first for you to relish! Correct me, as usual, if I am in error.
Collision versus Subduction zone tectonics.
The section is extremely interesting and shows many geological structures not currently known.
On the left-side of the section the Africa/Europe collision zone is seen under the white outline. If you compare this collision zone to the Japanese subduction zone on the right-side it is observed that the collision zone only gets about halfway down to the core but the Japanese subduction zone, just like the South and North American subduction zones, extends right to the core with the cool subducted material (2,400°C) thrust into the 4,500°C – 5,500°C Outer Core and digested.
So, many of the structures seen here are documented and in the right location, further evidence of EagleEye veracity.
Tonga Trench Australia/Pacific plate margin to Outer Core. Tonga Plumes. Landsat, chronologically coloured plan, and seismic tomographic section.
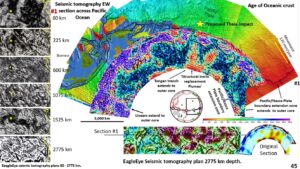
We will again look at the two main components of Plate Tectonics – the Mobile Mantle and the Plumes, to see if they are still valid. To do this we will enhance the original colour contour, seismic tomographic section (lower right) using the EagleEye system.
The Tonga Trench Australia/Pacific plate margin (centre), and other subvertical structures, extend strongly to the core straight through the Mobile Mantle. This invalidates the mobile mantle.
The Tonga Plumes (centre right – red) which are documented as being the strongest plumes have multiple strong flat and steep linear structures crossing them. This invalidates them as viscous, constantly ascending plumes.
We now examine the Nazca/South American plate subduction zone to see how it compares with current thinking.
Nazca/South American Plate subduction zone from surface to core seismic tomography.
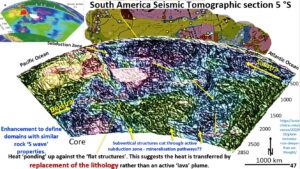
This figure shows the subduction zone under the wide area of South America at 5°S, enhanced by EagleEye from the colour contour section in the top-left.
The upper yellow arrows show the top of the subduction zone which is quite clearly defined. This is subducting cool oceanic crust (blue colour) which is pushed by the Nasca Plate right down to the outer core where it is cut off by the liquid Outer Core. There are huge volumes of oceanic and continental crust adding to the Outer Core.
An important geological feature to note in this section, that relates to the brittleness or ductility of the lithosphere, is the sharp boundary between the brown and blue rocks extending from under the Atlantic Ocean, on the right- hand side, to nearly down to the Outer Core on the left-hand side.
I suggest that this is a big flat fault system, no doubt caused by the inexorable movement of the Nazca Plate to the east and the pushing westward of South America by the opening of the Mid Atlantic Ridge. The whole American continent is thus sitting on flat East dipping, and flat West dipping pressure relief faults and is a pop-up continent.
Note the incredible amount of extra detail one obtains by having EagleEye structural geology.
B. Ring structures. Are EagleEye large impact ring structures valid?????? This is the burning question in many minds and a source of heated debate for 70 years😊.
We will look at a few documented impact structures and whether they were rendered visible by EagleEye using colour contoured seismic tomography, Landsat, Gravity and topographic images on which they can’t be observed.
If you can’t observe them on our fantastic current generation plans they don’t exist – right??? That’s the problem with the Leprechaun hypothesis!
Chixculub impact structure comparison between EagleEye enhanced seismic tomography at 27 km depth compared with a 3D gravity image.
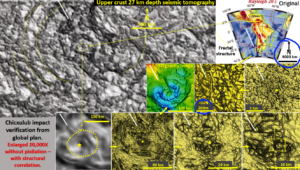
The top right-hand image shows the seismic tomography at a 4,000 km scale with no structures showing.
By a series of iterations of the Chixculub area we go from that 4,000 km scale right down to 200-meter scale at the centre of the Chixculub impact structure.
A comparison with the 3-D gravity image of the centre of the Chixculub crater (centre-right image) with the below-left image shows that the images obtained are geologically valid.
The detail of each image improves as you magnify the image. This (dithering) process has enabled me to enlarge the original seismic tomography plan, that shows no structure, 20,000 X with the final detailed image still showing the broad ‘structures’ seen in the original image.
This is the sort of thing that EagleEye process can do with any geophysical, Landsat, geographical, geochemical image. Is this useful?? Can you see the structures?
This is fantastically useful for geological mapping and exploration targeting.
See the original more detailed paper at https://www.geotreks.com.au/work/giant-ring-structures/watchorns-eagleeye-structural-recognition-and-enhancement-system-chicxulub-impact-structure/ .
Watch the original webinar on South America at;
Mien (my Aseda) Impact crater, SE Sweden, on EagleEye enhanced Landsat and Topography plans.
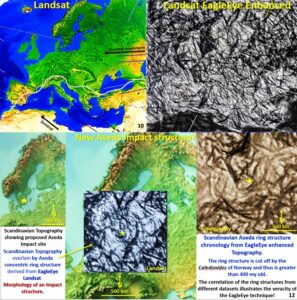
When I first found this concentric ring structure I called it Aseda. I suggested that it be explored for an impact origin. I was 130 years late as it was discovered and confirmed as an impact structure by Holst in 1890! 😊. However, this proves that the structure that I outlined is a recognised impact structure, validating EagleEye structural geology. I also discovered it in enhanced topography (centre-right image)
This also proves that there is a huge wealth of valid geological information available in our ubiquitous Landsat plans that can be used for mapping and exploration (see top-right image) if you have an EagleEye type system to enhance them.
Scottish Lairg Impact Structure on EagleEye enhanced Landsat plan.
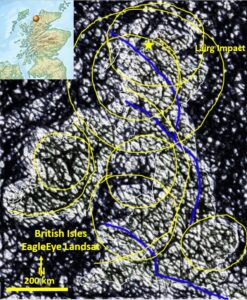
Although less well defined than the Swedish impact structure, one of the ring structures I defined on the British Isles corresponds with the Lairg Impact Structure in Scotland (Simms 2015 https://www.sciencedirect.com/science/article/abs/pii/S001678781500098X ). The EagleEye plan was interpreted before I found out about the Lairg impact.
This validates the EagleEye systems structural geology and demonstrates the wealth of valid geological information available in our ubiquitous Landsat plans.
North American known near-surface impact structures on the Potato Earth gravity plan.
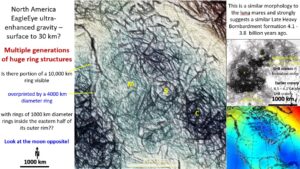
The main observation should be that one can see clear, concentric rings which have been derived by EagleEye from the bland, colour contour gravity plan. Is there another geophysical package that produces these results?
Can anyone not see these rings?
The lower-right inset is the North American Continent gravity (potato earth) image enhanced by EagleEye. Gravity structures are near surface so these are not LHB impacts. However, even these impacts are sizeable. The aspect to note is the order of magnitude size difference of the outer ring structure compared to the recognised central impact size.
They are similar in size to Lunar impacts, central-right image.
The two eastern ring structures observed are well known smaller impact structures on the surface. C is Chesapeake Impact (80 km diameter and 30 My old) and S is Slate Island Impact in Lake Superior (30 km diameter and 450 My old). The larger western ring structure M is located near the Beaverhead impact structure (60km diameter and 600 My old).
They are smaller than the deeper ring structures suggesting that the projectile size has been decreasing through time. It is interesting that the C and S impact outer ring dimensions are 500 – 1,000 km in diameter that the centres are only 30 – 80km diameter. However, M has a 60 km diameter but the surrounding rings are up to 3,000 km diameter.
This is further evidence of the validity of EagleEye structures.
C. Regional and mineralised structures.
There are many EagleEye enhanced structures that correlate well with documented structures.
I will just highlight three. The Ora Banda geological structure. The well-known Norseman Wiluna mineralised line and the Stawell gold mine structural geology all of which have been documented by myself and others.
Ora Banda area magnetics plan.
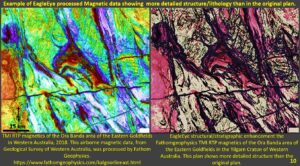
This was an exercise to define greater detail in the Ora Banda magnetics plan. This is a control plan to see if the structures defined by EagleEye were somehow shifted, or randomised. They behaved perfectly and the structures are much clearer and more detailed!
Yilgarn Craton Seismic tomography. Norseman Wiluna tectonic trend.
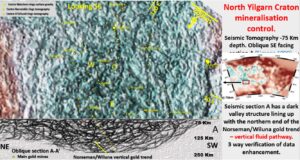
Geoscientists familiar with the Yilgarn Craton will recognize the Norseman-Wiluna antiform (darker structures with mines) up the centre of the plan. This structure matches a strong subvertical structure on the seismic tomographic section (looking SW) north of Wiluna. Note the good correlation between the darker structures and the main mines. This is repeated on every plan and section I have completed in the Yilgarn, and around the world, and confirms the veracity of the EagleEye structures in three dimensions.
Mine Scale geological structures.
Magdala mine, Stawell, Victoria from a 3D magnetic inversion section.
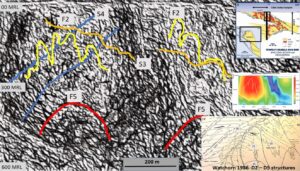
I picked this area to validate EagleEye imaging because I thoroughly know the 3D structures in the mine area having completed my MSc thesis there.
The middle-right image shows the colour contour 3D magnetic inversion section through section 254 of the Magdala mine (Smith and Frankcombe 2006) from which the EagleEye image was derived. Warm colours are conductive and/or magnetic.
The yellow line shows the drilled Magdala dome with sediments above and basalt below. The blue line in the bottom left is South Fault.
This cross-section and other figures in the thesis prompted the exploration for the Golden Gift ore bodies which gave Stawell Gold Mines a further 22 years life and it is still operating!
We will be trying to see this well drilled out lithology and structure in the EagleEye enhanced image (main image).
Structures and lithologies are observed that relate to mapped and drilled reality.
This enhanced image, while it looks very cluttered, shows a lot of structure.
– The flat East dipping structures correlate with South Fault.
– Steep East dipping ribbon like structures correlate with East Limb Fault and Stawell Fault.
– The basalt shows as more solid lithology (white patches) in the central left area. The top of the image shows as domal structures (upward darker arcs) between the more solid lithologies underneath and the blander but more finally structured sediments above.
– In the bottom left of the image the basalt has moved to the left (eastward) under South Fault. This is exactly what the drilling shows.
The figure in the lower-right is from my Watchorn 1986 MSc thesis. The EagleEye image has all of these structures in their correct attitude and location – confirming their validity.
Conclusion.
In all the above EagleEye enhanced plans the structures relate to documented structures and thus represent reality. To intimate that other deeper ring, bowl, dome, rift, subduction and plate margin structures with the same attributes are different to those shown, and thus can’t be believed, would be ingenuous.
If the EagleEye images represent known structures then;
- There are global brittle structures from the surface to the Outer Core. They are abundant and very persistent and cut through where the Mobile Mantle and the Plumes are supposed to occur thus they invalidate the thin accreted crust, mobile mantle and plumes.
- All the internal Plate Margins observed are subvertical structures extending from the surface to the core and cut through the Mobile Mantle. This invalidates the ‘mobile’ part of the Mobile mantle.
- Many of the largest continental blocks are structurally brittle to the core thus Global tectonics is by surface to core Block movement, not by surface Mobile Mantle, ascending Plumes and thin surface Plate movement.
Summary, if the EagleEye structures are real then there is brittle lithosphere to the Outer Core which precludes a Mobile Mantle, there are no lava-lamp Plumes and Plate Tectonics is not operable under those conditions. (Did I repeat myself there 🙂 .
If you can see these deep structures in my figures, then you can tap the leprechaun on the shoulder and say “Hi Mate”, welcome to the real world 😉.
Further comments, after having carefully read the above, are most welcome.
Happy reading and learning.
Bob

