Yilgarn geology research.
This paper is the result of 45 years research of the Yilgarn by the author. This research is (gradually) changing the fundamental way in which the geology of the Yilgarn is viewed and explored. Research by the author over the last 20 years has defined the ‘skeleton’ in the lithosphere beneath the Australia’s thin crust revealing the underlying source structures. Perhaps, also revealing the genetic source of the mineralisation?
This latest research also provides empirical proof of giant ring structures and their intimate relationship to mineralisation at all scales. There is excellent correlation on the surface between the topography, Landsat, radiometrics, gravity and magnetics data. There is also good correlation with the lithospheris structures allowing 3D interpretation.
Watchorn GRS has the morphometric dimensions, of a 1,000 km diameter, complex impact structure. Prima facies evidence that suggests Watchorn GRS’s impact origin is observed in diamond drillhole ELV 071 drilled into the strong Leonora median ring. My core log is attached as Appendix 1 to the paper.
Seismic tomography research into craton formation.
Images of the seismic Tomographic Velocity Model of the lithosphere-asthenosphere boundary (LAB) for Australia at 250 km depth show large areas of Australia has underlying Archaean cratons at 250 km depth. The deep cratonic roots appear to cross the varying surface geochronologies. This corroborates with the author’s ongoing research on giant ring structures that has been published on geotreks.com.au.
What is the reason the oldest original Earth cratons still exist over large areas?
During the Hadean eon (4.5 – 3.8 Ga) there was large scale volcanism piling heavier mafic material over the craton areas pushing the increasingly felsic roots deeper and providing buoyancy similar to a submerged cork. There was probably up to 100 km thickness of heavier mafic rocks extruded during the intense Late Heavy Bombardment (LHB) period extending over 300 million years. Volcanism and subsequent erosion gave great buoyancy to these cratons. It is suggested that most of the largest > 4.1 – 3.8 Ga LHB created cratons still exist because of this great buoyancy.
Seismic and seismic tomography sections suggest these giant ring structures are deeply buried and therefore cannot be proved to be impacts by the restrictive criteria currently used for Earth impacts. The Hadean Yilgarn ring structures cannot be proved as impacts by only using shock affects criteria at the surface. If they are older than ~3.8 Ga, as the Yilgarn seismic and seismic tomographic traverses show, they will not outcrop as they were buried during the LHB and its subsequent enormous outpouring of lavas which contain no shock structures.
If these Yilgarn GRS occurred on the moon they would be classified as Impact Structures based on morphology alone. However, if the lava fields on the moon were examined for shock structures their genesis would not be attributed to impacts as there would be no shock structures preserved in these post LHB lunar rocks.
Extensive use of tomographic structural data in plan and seismic section is critical to the correct classification of these structures on Earth.
Australian seismic tomographic research.
The basis of this paper is the application of detailed seismic tomography in plan and section. A search of seismic tomography publications in Australia suggests that detailed structural seismic tomography (5-10 km wide dimensions) has not been used to determine Australia’s detailed deep geological structure. Australian seismic tomography at -75 km depth (velocity perturbation%) from Fishwick and Rawlinson 2012 was used as the base data for this initial research.
The structural enhancement method used in this paper gives detailed, clear, real structures that relate to published, well researched surface structures and mineralisation.
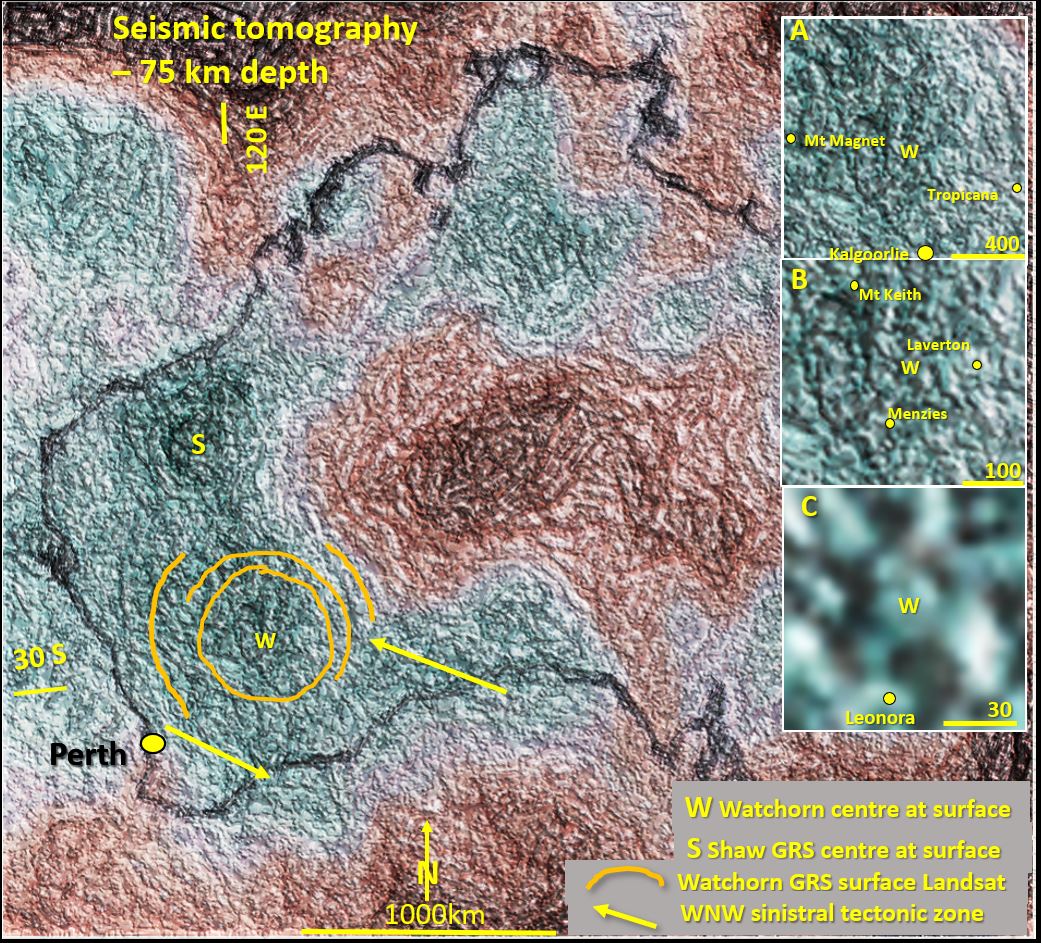
Detailed structural images are able to be produced in plan and section as they are in medical tomography. The first image is an example of Australia in enhanced tomography.
These detailed plans open up a whole new world of structural research to those exploring the structural geology and mineralisation of Australia and the world. Of great interest will be the research into the relationship of mineralisation to the 3D structure of Australia. This paper will provide a leap forward to all serious researchers.
The author will be using the standard plan and cross-section method of structural interpretation to analysis the 3D structure of Australia, commencing with the Yilgarn. This will be carried out while Geoscience Australia will be using their latest techniques to progress the same tasks. It will be interesting to compare progressive results.
Yilgarn geology seismic tomographic research.
A structurally enhanced image of the Yilgarn Craton at 75 km depth was produced. There is an abundance of detailed structural geology seen. The image is a subset of the Australia-wide image First image). The tomographic plans produced are versatile in that they can be enlarged with no further processing from Australia-wide data to local-scale with the structures still being clearly definable (see insets in first image).
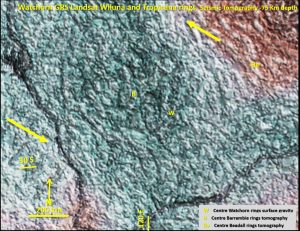
A structurally enhanced image of the seismic tomographic section at 30˚S across the Yilgarn Craton was also produced. There is an abundance of detailed structural geology seen on this 30˚S section. The research also examines the correlation of the 30˚S seismic tomographic traverse with the -75 km depth plan structural geology.
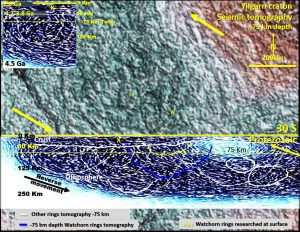
Interpretation of tomographic section 30˚S shows that the Moho separates the crust and more structurally complex lithosphere at about 40-60 km depth in the Yilgarn. Semicircular (bowl) structures on section correlate with the giant ring structures on the -75 km level plan. The bowl structures terminate on the Moho suggesting they formed earlier.
Yilgarn geology structural deformation sequence research.
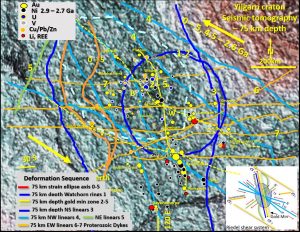
A provisional structural sequence at 75 km depth was formulated based on structural overprinting relationships.
0–1, Oldest observable structures. 4.5 – 4.1 Ga. These structures are overprinted by the giant ring structures.
1-2, Giant ring structures. 4.1 – 3.8 Ga. These most likely formed during the LHB.
2-5, Gold mineralisation structures. These structures predate the GRS but also cut them suggesting re-activation after the LHB and as late as 2.6 Ga for the last Yilgarn gold mineralisation.
3, NS linears. These strong structures may be a later, separate Riedel shear zone system.
4, (0-5) WNW linears. These structures form the P and R component of the WNW Riedel shear system. They are long lived from pre-GRS (> 4.1 Ga) to sharp late linear features (~2.6 Ga).
5, (5-7) NE to NNE breaks cut by the EW structures (2.9 – 2.6 Ga?).
6, ENE linears cut by EW structures. These linears have the same direction and are observed cutting through many of the major goldfields. In Mt Magnet, Kambalda and Norseman, they predate, but are associated with, the gold mineralisation of 2.65 – 2.6 Ga.
7, (5-7) EW structures. There are several generations of EW structures observed. The earliest are displaced by the P and R Riedel shears and the last are sharp structures occupied by Proterozoic dykes from 2.47 – 2.10 Ga. EW dykes as young as 1.21 Ga are recorded in the SW Yilgarn Gnowangerup-Fraser dyke swarm.
Yilgarn mineralisation research.
The mineralisation structures on the -75 km level are vertically below those on the surface.
There is a closer correlation of mineralisation with the rings and linear structures at the -75km level in the lithosphere than at the surface, suggesting a close lithospheric/minerals relationship as the mineralised fluids and magmas ascend vertically.
This also suggests that the surface crust obscures the deeper structures and has formed under a different geological regime. Perhaps the lithosphere was formed (or solidified) by the late Heavy Bombardment and the surface crust was formed by plate-tectonics.
Gold and nickel mineralisation. On the -75 km level the gold/nickel mineralisation correlates well with NNW and NS structures especially where these structures follow a ring structure, or where they are crossed by a ring structure. The largest mines (of all mineral types) correlate with the rings in each area.
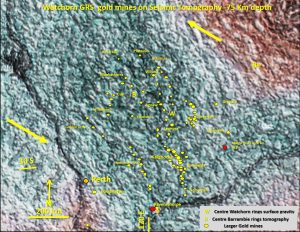
At 75 km depth nickel/gold mineralisation almost always lies in the sharp, darker valleys (faults/intrusives?) whether in the linears or on the GRS rings. These linear structures predate the GRS but also cut them suggesting re-activation after the LHB (4.1-3.8 Ga) to as late as 2.6 Ga for the last Yilgarn gold mineralisation. Most gold/nickel mineralisation in the Yilgarn is ~3 Ga – 2.6 Ga in age.
The 30 S section on the next image has been specifically enhanced to highlight linear (planar or curviplanar) structures so they can be compared with the same structures on the -75 Km tomographic plan. The structural fabric associated with mineralisation can start to be seen in both plan and section. The Norseman-Wiluna gold corridor extends vertically 300 km below the surface.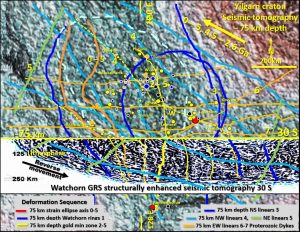
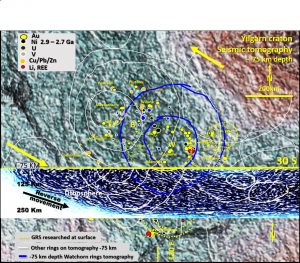
Yilgarn seismic tomography -75km depth interpreted plan showing the mineralisation paths and the deformation sequence. The vertical gold mineralisation zones are shown on tomographic section 30 S. Conclusions
Geoscientists have researched extensively to discern these controlling structures, with some near-surface local success but the overall Cratonic control has not been discovered. Have we been examining them too locally? It is only when the structures are viewed from afar, as a complete structural set, that their pattern becomes clearer.
These observations mark a considerable advance in our understanding of Yilgarn craton structural geology and the structural position of the gold/nickel – indeed all – mineralisation and its genesis.
Future research will examine the Yilgarn at the -150, 225. 250 and 300km levels. Seismic tomographic sections 50 km apart would be ideal for research. currently I only have located 30 S and 25 S Seismic tomographic sections. Geophysicists able to produce those other sections, and closer spaced levels, would receive my earnest thanks 😊.
For the full much more detailed paper with 28 top class figures and plenty of hypotheses click on the attached file below. If you find this interesting – you’re not a serious geologist if you don’t – then share it with your colleagues! ——-
| aa YW #8 Watchorn GRS corre;ation with Seismic tomography 1 (AutoRecovered).pdf | 3 MB |

