


Yilgarn craton correlation of mineralisation and geology with the 30 S and 120 E orthogonal sections.
The basis of this paper on the Yilgarn Craton is the application of detailed seismic tomography in plan at -75 km depth and on EW seismic tomographic section 30˚S and NS seismic tomographic section 120˚E. It follows paper YW #8 2019 giving background to the methodology of the seismic tomography enhancement https://www.geotreks.com.au/work/giant-ring-structures/yilgarn-geology-tomography/
Detailed structural images of the Yilgarn craton are able to be produced in plan and section. This research is defining structures to < 5 km width for the first time. High, 5-10 km, wide resolution structural seismic tomography has not previously been used to determine Australia’s detailed deep geological structure.
There is good correlation with the lithospheric structures between plan and the two sections allowing 3D interpretation. The controlling tectonic system and mineralising pathways are starting to be outlined in 3D using this detailed tomography. This latest research also provides further independent empirical evidence of the Yilgarn giant ring structures and shows their intimate relationship to geology and mineralisation at all scales.
Yilgarn Craton Structural geology observations
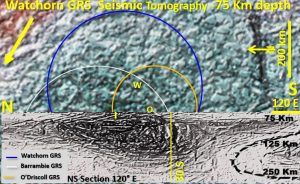
The ring and linear structures appear as darker tracks (valleys) on the structurally enhanced image of the Yilgarn Craton at 75 km depth. This may be because they have a faster than average velocity and are thus harder rock, perhaps composed of intrusives.

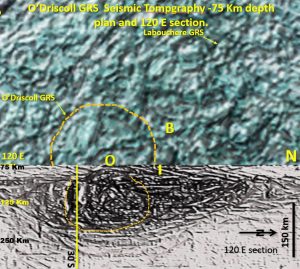
The NS 120˚E section shows large bowl like arcs down to 250 km. These correlate with the -75 km Watchorn GRS and O’Driscoll GRS. EW, ESE and ENE structures in plan correlate with dark subvertical structures on the 120˚E section. The true dip of these structures can be calculated and so the 3D structure of the Yilgarn can be worked out.
The linear structures are better developed in the crust than the Lithosphere suggesting later large-scale tectonic movement (perhaps plate tectonics) and they may be associated with the post LHB deformation. This shallow surface crustal deformation sequence is the only deformation sequence currently recognised and documented for the Yilgarn Craton.
On the 120˚E section there is a circular contorted area at the centre of the O’Driscoll GRS (O). This contorted area most likely represents the centre of O’Driscoll GRS on the NS section. The surface data suggests that O’Driscoll GRS was one of the last to form and this appears to be the case in section also as the centre clearly overprints the other structures on the 120˚E section. The deepest bowl structures have a smaller radius of curvature and appear to relate to the O’Driscoll GRS.
Yilgarn Craton genesis and survival
Analogy with Earth’s twin planet, Venus, suggests that during the Hadean eon (4.5 – 3.8 Ga) the numerous impacts caused large scale volcanism which extruded heavier mafic material over the craton areas pushing the increasingly felsic roots deeper and providing buoyancy and forming the Earths cratons. Because of this great buoyancy they have floated above the plate tectonic subductions and survived.
Yilgarn craton Mineralisation
The mineralisation structures on the -75 km level are vertically below those on the surface suggesting vertical mineralising pathways. The following figure summarises the interaction between the gold NNW trends, the Watchorn and O’Driscoll giant ring structures, the domal structures and the vertical gold pathways.

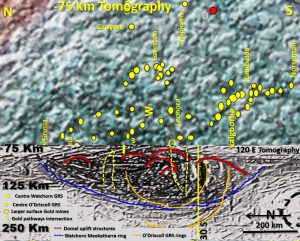
Both the NS 120˚E section (-75 km surface to the left) and EW 30˚S sections show large arcs down to 250 km. These correlate with the -75 km level Watchorn, Barrambie and especially the O’Driscoll GRS. On the NS 120˚E section the lithosphere above the O’Driscoll GRS centre is pushed up and large upward facing arcs (domes) are observed. This domal architecture is ideal for concentration of mineralising fluids and magmas. Seismic sections 10 GA YU 01 and 01 AGS NY 01 show similar, small scale domal structures in the crust, immediately under the best mines in each region.
There is a closer correlation of mineralisation with the rings and linear structures at the -75km level in the lithosphere than at the surface, suggesting a close lithospheric/mineralising pathways relationship as the mineralised fluids and magmas ascend vertically.
The mineralisation timing at the surface is post 3.8 Ga with the main mineralisation from 2.9 – 2.6 Ga. This occurred during the formation of the crust and may correlate with the commencement of plate tectonics and the associated breakup, subduction and melting of much of the underlying, mineralised lithosphere.
However, given the close mineralisation – lithospheric structural relationship the mineralisation may be related to original mineral input by the 4.1 – 3.8 Ga LHB impacts and its subsequent redistribution by the processes that formed the 3.8 – 2.6 Ga crust.
Yilgarn craton Geochronology
The following figure is the Yilgarn Craton plan showing Nd ages from Cassidy and Champion in 2006 with the 30 S seismic tomographic section showing the vertical structure and the probable geochronology of the geological layers in the crust and Lithosphere.

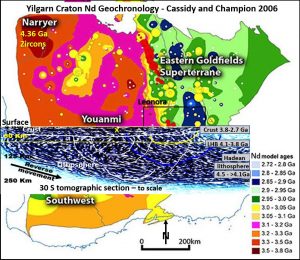
The sectional geochronology has been estimated as follows;
The Yilgarn craton surface crustal age ranges from 2.7 in the SE to 3.8 Ga in the NW. In the more deeply eroded NW Narryer area zircons as old as 4.36 Ga have been found at the surface. This suggests, as do conventional geology principles, that older lithologies lie underneath.
On the two sections bowl structures terminate beneath the Moho suggesting they formed well before 3.8 Ga, under the oldest surface lithologies. Their morphology, both in section and plan, is that of giant impact structures and the only time of dense impacts was the Late Heavy Bombardment from 4.1 – 3.8 Ga. All evidence points to their formation by LHB impacts. The lithosphere that they impacted into has to be older and would have formed between the separation of the Earth and moon at 4.5 Ga and the earliest LHB impacts at 4.1 Ga.
Both sections show that the 50°E dipping Ida Fault and Terrane boundaries are continuations of through-going major structures in the lithosphere suggesting these crustal structures are extensions of these basement structures through to the surface. These structures however show no movement since the formation of the giant ring structures in the LHB. The GRS are still circular suggesting the Lithosphere at least has been rigid since 3.8 Ga.
This is a major problem for the hypothesis that the Yilgarn Craton formed by accretion between 3.8 and 2.7 Ga. There is the possibility that the thin surface crust accreted or slid over the solid lithosphere described by Blewett et al. 2012 https://press.anu.edu.au/publications/shaping-nation . However, structural studies of seismic sections 10 GA YU 01 and 01 AGS NY 01 show there is not a major structural dislocation between the Lithosphere and crust. The youngest crust is located above the youngest and largest giant ring structures. The different ages of crust is probably due to vertical movement and differential erosion.
Happy hunting !!
To read the full paper with many interesting observations and hypotheses click on the file link below ———-
| YW #9 Yilgarn Craton tomography 75 km depth and 30 S and 120 E sections1.pdf | 3 MB |
If you know your exploration or geophysical colleagues may be interested in getting their teeth into some new data, techniques and and geological insights share and follow the new papers on this website —-