In the last section (7) we looked at the tomography of the African continent at 300 km depth. In this section we will be looking at the Australian Yilgarn Craton mineral fields and the Carlin/Battle mountain/Butte/Bingham Canyon area in Western USA using tomography at 300 km depth. We will compare exploration targeting in these fantastically mineralised areas with Africa at 300 km depth seen in the previous section.
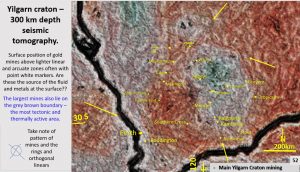
This figure shows the West Australian Yilgarn Craton at 300 km depth. There is a very strong orthogonal pattern of linears at that depth which suggests that, contrary to current thinking, the lithosphere is still rigid at that depth and has remained so since the Late Heavy Bombardment which finished 3.8 billion years ago.
This figure is a good example of my method of targeting for mineralisation.
Nearly all the mines lie above white patches on the linears. In particular the large mines and all the new mines Nova, Tropicana, Gruyere and Plutonic lie on these white blobs. The best mines also lie on the brown – grey boundary which is the thermally most changeable area where the mantle is insitu replacing the lithosphere at that depth.
This figure is a good example of one of my methods of targeting for mineralisation.
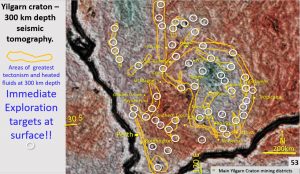
Nearly all the mines lie above white patches on the linears. In particular the large mines and all the new mines Nova, Tropicana, Gruyere and Plutonic lie on these white blobs. The best mines also lie on the brown – grey boundary which is the thermally most changeable area where the mantle is passively, insitu replacing the lithosphere at that depth.
This plan shows the white area targeting exercise. All the areas that had the same white blob appearance as the areas that the mines had have been circled. There are many unexplored areas with the same characteristics. These are the most likely areas at the surface to find mineralisation based on what has already been mined. There are years of exploration targets just in this one plan!
Note the areas in the south west that correlate with new big Ni/Pt and gold discoveries. The large arc to the east is the Nova Tropicana, Gruyere arc – many interesting locations there. The top of the plan shows interesting untested areas in the Murchison and Gasgoyne regions.
Comparison of the Yilgarn with the Butte, Bingham Canyon, Carlin district in Western US.
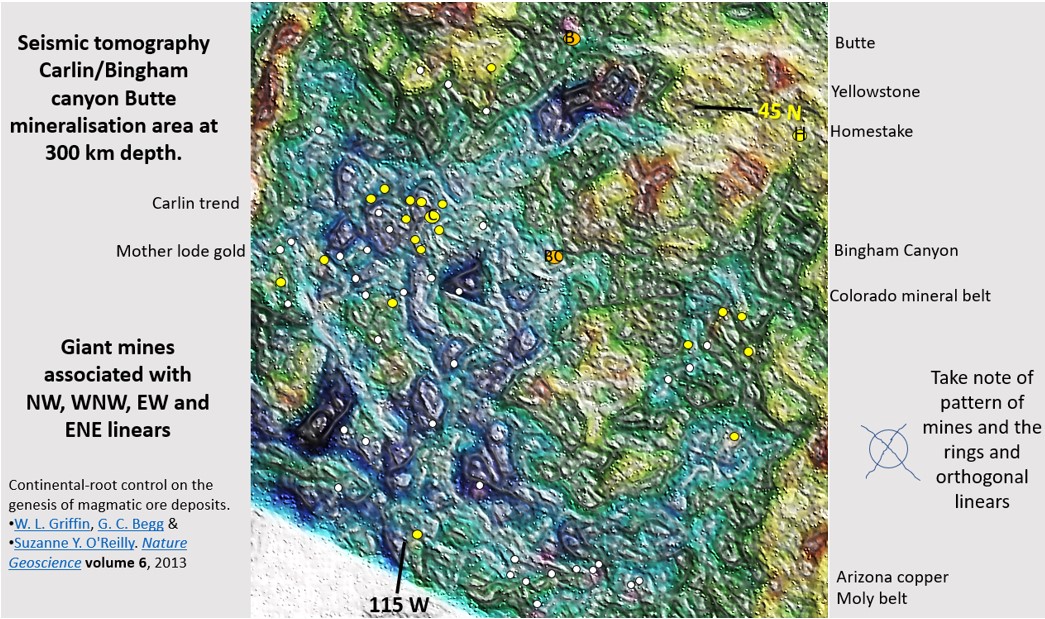
I decided to have a look at the elephant country Carlin, Butte, Homestake, Bingham Canyon areas in the United States using seismic tomography at 300 km depth (Griffin et al 2013). The Carlin area is a classic dome and basin mining field.
In Western Australia the Telfer mining field also shows up at 300 km depth as a dome and basin field (Figure 28, centre left side). So, we will look at this Western US plan and see if there is structural evidence for dome and basin controls on mineralisation that looks similar to those at Telfer.
From the evidence in Australia, the structures controlling these dome and basin structures are formed at 300 km depth, not near the surface. Is it the same at Carlin?
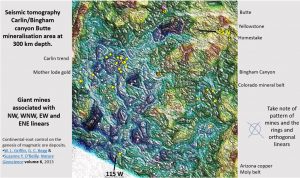
This is the first time that this type of plan has been produced for this area.
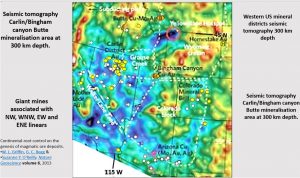
This is an ultra-detailed structural geology plan of the Carlin, Butte, Homestake, Bingham Canyon area with the main mines superimposed. Strong NW, ENE, and EW structures are plainly visible. Carlin lies at the centre of all these structures and to a lesser degree the other main mines do also. One should be able to target interesting areas of the plan with this amount of detail combined with the targeting systems currently used for that area.
Of course specific priority areas can be enlarged and re-enhanced for better detailed targeting as in the insets below.
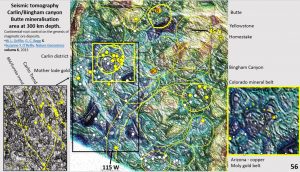
This plan shows the linear and in particular the ring structure’s relationship to the mines. Once again, the biggest mines are associated with the edges of the rings and the intersection of the rings especially where there are a couple of linears in the favourable direction. In the right-hand side inset of the Carlin area the rings can be clearly seen and are very similar in morphology to the rings in Finland in previous figure Figure 44. It is a classic dome and basin structure. Carlin and all the big mines lie on the ridges between the domes and not on the domes themselves which at 300 km appear to have no associated mines. This is a good targeting tool.
Carlin mine lies in a NS and EW corridor, on ENE and WNW linears (left inset). It also lies on the rim of a large concentric ring to the east and on the boundaries of two rings to the SW and West. A real hotspot and the sort of targeting criteria to take note of in the rest of the area. How does this structural geology relate to the surface structural geology? I’m sure geologists looking for the next Carlin will be keen to find out.
Conclusions.
When figures 50 and 51 showing the African Tomography at 300 km are compared with the above Australian and US figures it is noted that;
The best mines at the surface lie on the edges of ring structures, on the strongest linears and on the interface where the colder cratonic lithosphere is being resumed by hotter deeper lithospheric material at 300 km depth.
These criteria form the basis for a new exploration targeting regime and also that the mine forming structures and fluid conduits form at 300 km depth or deeper!
Share this important knowledge with your colleagues and go out and prove the areas indicated in the Western Australian Yilgarn before the next round of big mines are found on these structures. Maybe some geoscientist can do a similar targeting exercise on the African and US areas before I get around to it??
Happy Hunting
Bob

