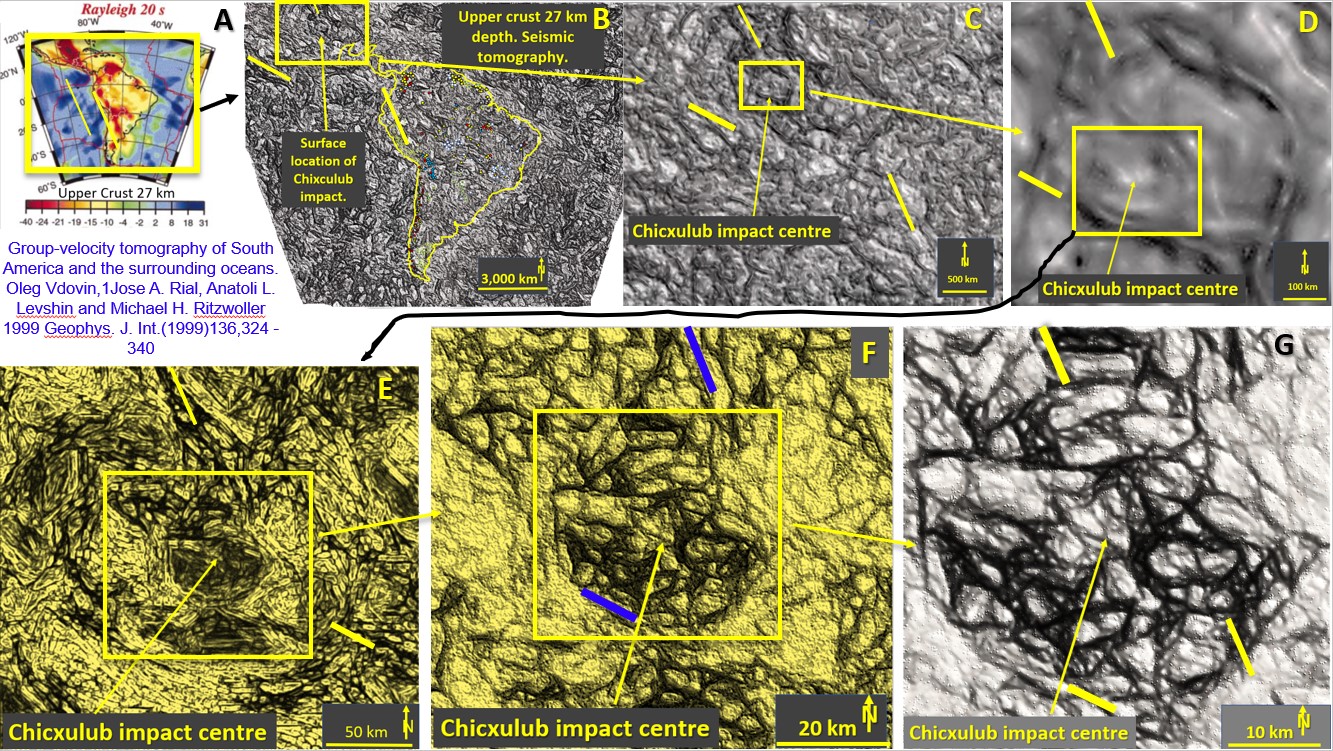
Figure 1. EagleEye enlargement and ultra-detailed enhancements of Chicxulub impact structure.
There has been much valuable, robust discussion on my last five posts as to the merits of my EagleEye structural recognition and enhancement system. This has been going on since 2016 after I encountered ‘headwinds’ at UWA when I was in the throes of a PhD (not completed) and where I was developing the embryonic version of the EagleEye system. The headwinds were strong 🙂 and rightly so at the time.
However, being an avid sailor I used those headwinds as an impetus to power my way, against the wind, into developing EagleEye into this more advanced, much more ‘universally usable’ product.
It has been claimed that I am a bit gung-ho in my claims EagleEye is paradigm changing.
I have also been told that I upset people with my assertions that EagleEye does exactly what I claim it does and state repeatedly in my papers and videos (based on EagleEye structural geology evidence) my outlandish claims that there is no conveyor belt, totally mobile, mantle 🙂
One can’t shoot sacred cows – as they say in India!
So to answer those claims, I claim 110% that EagleEye, although using an unconventional technique does use structural recognition software and is able to get ultra-detailed images at great magnification from very fuzzy starting images. You can make your own assessment of EagleEye’s success, or otherwise.
I have only the one figure for those of you that haven’t the time to go to the more detailed posts on my Website geotreks.com.au to check the validity of my claims.

The figure above should be self explanatory. It details the broad process (but not the intricate detail) followed in getting the ultra-detailed image (G) of the very brecciated core uplift of Chicxulub impact from image A. Image A is a seismic tomographic plan at 27 km depth that extends from the Pacific Ocean through South America to Africa, a distance of 11,000 kms.
This starting image A is really just a fuzzy, colour contour plan of the very smoothed digital data (Vdovin et. al., 1999). Currently, not very much more detail can be got from these sort of plans that the average geoscientist can use for more detailed geological mapping or exploration targeting. This is unsatisfactory considering the state of the medical and other industry’s fantastic treatment of similar data!
The EagleEye system can get a lot of structural detail from these type of plans and that detail is immediately usable by geoscientists.
If you follow the EagleEye images from B to G you will see that the Chicxulub impact is geologically rendered (see previous posts for the geophysical detail) and is hugely magnified. Most importantly, all through the process as each enlargement occurs the level of detail increases. This process can continue down to the a much smaller scale as I have proved in other posts on the Yilgarn, Stawell, Carlin, Abitibi and other mineralised areas for clients.
Apart from the gross impact geology/geomorphology, one can follow the individual NNW and WNW structures (yellow and/or blue depending on background) right through from image A to G.
This suggests extremely strongly that the EagleEye system is locating and rendering those structures accurately. If you care to try it yourselves there are many other structures that can be followed right from the 3,000 km to 10km plan. Don’t just take my word for it 🙂
I would like you to carefully examine each image and then give me your ‘well considered’ ‘technical’ comments please.
Cheers
Bob
PS I’ll get onto the Paradox and Pandora’s box side of the equation next post.
Obviously EagleEye is interesting people – see stats from the last LinkedIn post https://www.linkedin.com/in/bob-watchorn-97b95624/recent-activity/shares/.
(Individual visitors in last 2 days)
Profession

