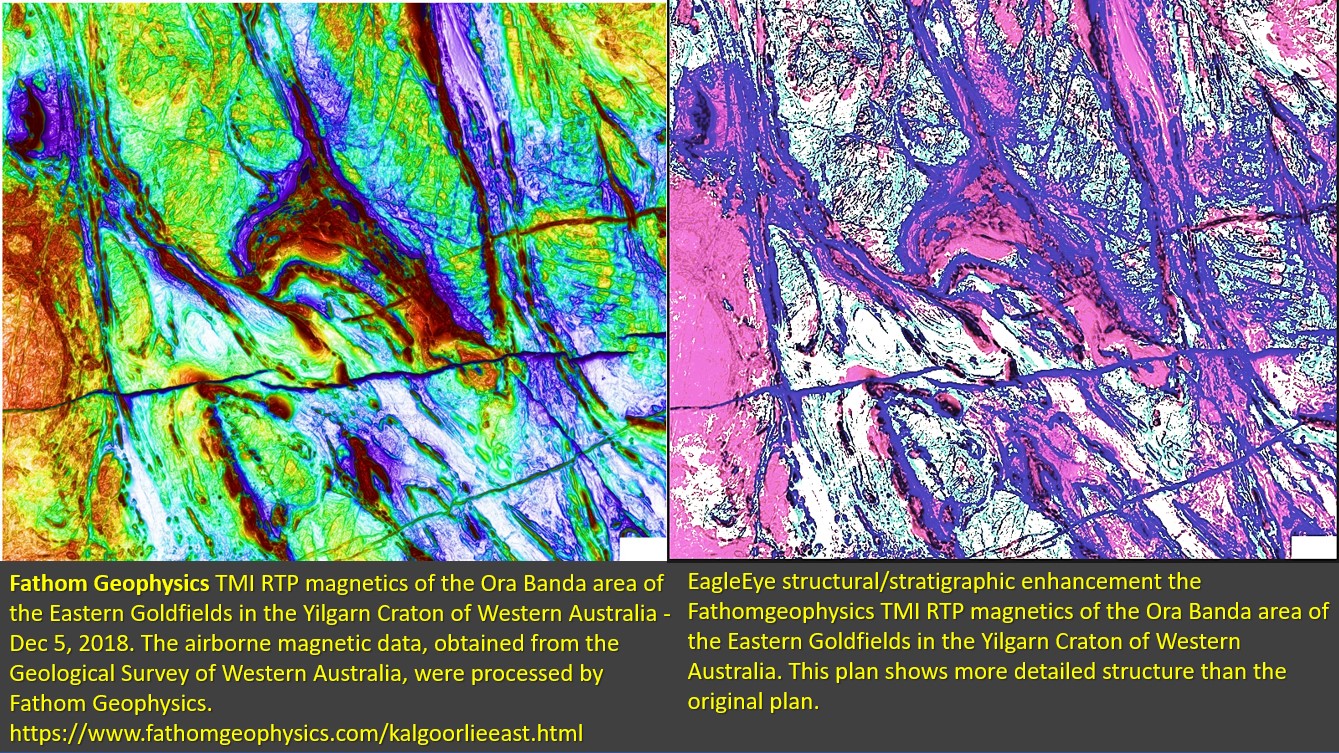
Figure 1 above. Ora Banda area, Falcon Geophysics and EagleEye Magnetics enhancements July 2022. To view the detail enlarge the image!
The above Falcon Geophysics TMI RTP image is from https://www.fathomgeophysics.com/kalgoorlieeast.html, published Dec 5, 2018.
To quote their paper;
The airborne magnetic data, obtained from the Geological Survey of Western Australia, were processed by Fathom Geophysics. Below are some of the results of this data-processing. Standard filtering results appear first, followed by some of the results of Fathom Geophysics’ advanced data-analysis and imaging.
They are some of the best geophysical images of this area (any area) I have seen!
My next post after this one will be on the structural geology of the British Isles and how that relates to the ancient henges. So I will be talking a lot about structures that no-one else has yet been able to produce. That does not mean they aren’t valid.
Objective. To verify EagleEye processed structures against known geophysically processed structures.
A while ago some ‘doubt’ was expressed on the credibility of the structures presented in my posts and video lectures. Surely not you say!! There followed some great discussions, as all new scientific processes should be subjected to!
I robustly defended the structures that I had been able to outline, giving proof of verifiable structures at all scales, like the Chicxulub crater – (https://www.geotreks.com.au/work/giant-ring-structures/watchorns-eagleeye-structural-recognition-and-enhancement-system-chicxulub-impact-structure/).
These posts were generally well received (up to 11,500 visits). However of course there will still be those that can’t see the structures so this post shows unequivocally EagleEye structures that mimic (and better;;) structures obtained by traditional geophysical methods. Of course I don’t claim the be a geophysicist and I depend on the excellent work of geophysicists to give me the initial image.
The structures I find are already hidden there in the geophysical data. I am not producing any structures that aren’t already there.
In this post I will do a comparison of the Fathom Geophysics treatment of the Ora Banda section of the Kalgoorlie 1:250,000 sheet (which are fantastic, and which I used as a base image) and my EagleEye treatment of the same data. You can be the judge!
Falcon Geophysics images.
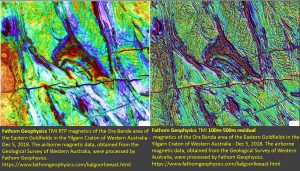
The left-hand image, as described by Fathom Geophysics is:
Results of reduction to the pole (RTP) performed on Kalgoorlie East total magnetic intensity (TMI) data. A magnetic dataset shows the variation in the Earth’s magnetic field caused by variations in the magnetic susceptibility of the survey area’s underlying rocks. This filter produces a field as though the survey’s observations were made at the Earth’s magnetic pole. The benefits of this image, compared to looking at the TMI data, is that (1) magnetic anomalies now sit directly over their source, and (2) anomalies are symmetric rather than skewed.
There is good colour coding of the magnetics of the various lithologies but the structures are ill defined and fuzzy.
The right-hand image as described by Fathom Geophysics is:
100m-500m residual processing performed on Kalgoorlie East RTP data. A residual is obtained by performing a differential upward continuation. The filter used to produce this image emphasizes magnetic anomalies attributable to shallow/localized sources.
The colour spectrum is reduced and the stratigraphy and linear structures are better outlined, in fact excellently outlined.
This was the most useful image that Falcon Geophysics produced for exploration targeting. This will be the standard to which I will aspire, or better, with my EagleEye enhancement.
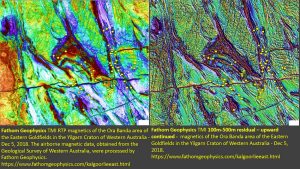
These are from the above images with the main mines from Paddington to Ora Banda area superimposed. For details of the mines and the geology go to figure 6.
In the left-hand plan the mines are seen to be following the high magnetic stratigraphy with some on WNW structures.
In the right-hand plan the mines are again seen to be following the high magnetic stratigraphy with the WNW structures now better defined.
EagleEye processed images.
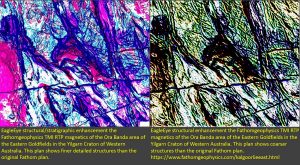
The left-side plan (using the Falcon Geophysics RTP as a base image) was enhanced by EagleEye to reveal the finer structures and stratigraphy.
It has had the colours, structural enhancement/definition, contrast and sharpness modified.
There is a wealth of fine detail seen in the flatter granitic areas. The stratigraphy in the complex greenstone areas also is much clearer and better defined. This was just a quick enhancement and with further work the higher magnetic, red areas would yield their stratigraphic secrets 🙂
The right-side plan (using the Falcon Geophysics RTP base) was robustly enhanced by EagleEye to define through-going linear structures.
In all of my exploration targeting work over the last 50 years I have found these through-going linear structures to be the most important structures. Where they intersect favourable stratigraphy, other strong linears and ring structures, is where you have the best chance of finding ore! So it is very important to be able to define them.
Traditional geophysical methods currently seem to have difficulty robustly defining these through-going structures. The 100m-500m residual, upward continued model of Fathom Geophysics comes as close as I have seen to achieving this important function.
EagleEye defines them excellently! The WNW linears can be seen to be forming within a wide corridor from the top right to just below the centre of the image. This does not come out clearly on the Fathom Geophysics images. They are the most important structures when you look at what structures the mines are located on the the image below. In addition there can be seen a sinistral offset of the NNW structures and high magnetic lithology by the WNW structures. This can be seen more clearly in the Yilgarn scale figure 6.
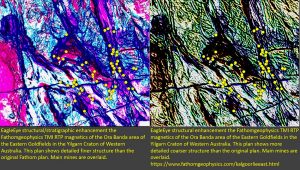
In the left-side plan the mines are seen to be following the high magnetic stratigraphy with some on WNW structures.
In the right-side plan the mines are again seen to be following the high magnetic stratigraphy with the WNW structures now much better defined. These through-going linear structures can now be seen to be cutting through the fold noses and limbs of high magnetics. This is where the mines are preferentially located and aligned across the high magnetics – aha, a targeting criteria!
Correlation of EagleEye with the published geology of the Kalgoorlie 1:250,000 geology map.
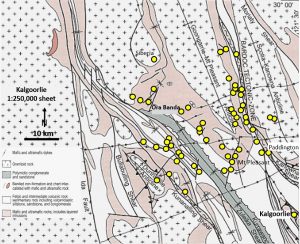
This map shows the Kalgoorlie 1 250,000 sheet geology with the mines overlayed. It shows the broad lithology and structures.
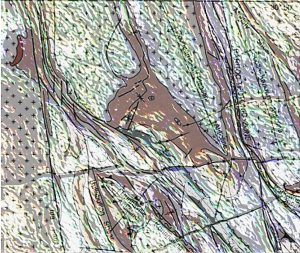
The ‘robust’ EagleEye enhancement correlates the published geology lithology boundaries, Proterozoic dykes and Shear zones. The form lines of the structures (not seen as clearly in any of the Fathom Geophysics images do represent the mapped fold and shear zone directions.
The importance of good enhancement of geophysical images to get good structural data and good exploration targeting.
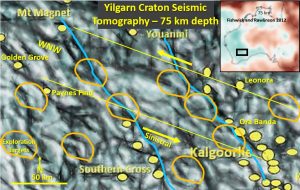
The base plan for this figure is an enhancement of continent wide seismic tomography at 75 km depth (top-right plan) https://www.geotreks.com.au/work/giant-ring-structures/yilgarn-geology-tomography/.
This image was done 6 years ago when I was first formulating the EagleEye methodology. Much clearer structures would now be able to be obtained. Enhancing structures from good data like Fathom Geophysics is easy but getting detailed structures from continent scale, colour contoured, fuzzy data is much harder.
As far as I can ascertain EagleEye is still the only enhancement method that can get the structures seen above from what looks like a ‘blank canvas’??” Prove me wrong??
Further validating the structures in the image is something that cannot be attributed to coincidence. All, and I mean all, of the mines on the plan are on the dark ‘shear zones’. How could this occur if the structures are random! One would expect an even distribution on light and dark.
Now, if you have been following my research exploits all around the world you will have noticed that gold, tin, and all minerals that occur in shear zones do occur in the dark areas.Another example is the Carlin area in North America described in post https://www.geotreks.com.au/work/giant-ring-structures/butte-carlin-bingham-canyon-mining-area-eagleeye-seismic-tomography-300-km-depth/
Conversely all of the mines such as Iron, copper silver/lead/zinc and others that generally occur in basins nearly always occur on the light (more solid areas). This ore than a coincidence – the structures are factual.
The local structures observed above are also valid according to the local-area geology and geophysical mapping. What does not appear in Yilgarn geology maps are the details of the regional crosscutting WNW linear and NNW arcuate structures as seen above. As mentioned these are the most important Exploration Targeting structures.
If you examine the continent-wide plans in https://www.geotreks.com.au/work/giant-ring-structures/yilgarn-geology-tomography/ you will observe that these WNW structures extend from the Eyre peninsular in South Australia through to Shark Bay on the NW coast – a distance of 3,000 kilometres.
Included on this plan are a few of the many basic exploration targets that are based on the intersection of the WNW and NNW structures. The WNW structures are later and move the NNW structures sinistrally. This is a common feature over Australia and all of the other continents I have researched.
Of course anyone who wants their property structurally mapped and exploration targets produced only has to message me 🙂
Conclusion
The EagleEye structures correlate well (100%?) with the Fathom Geophysics structures. In the more robustly processed EagleEye image the WNW through-going structures are much firmer and through-going than the Fathom Geophysics WNW structures. This is an important distinction as the mines form in the high magnetics where the WNW through-going linear structures cut through.
If the Fathom Geophysics structures are considered valid the same should apply to the EagleEye structures.
Because the standard geophysics plans do not show these WNW structures cutting through the high magnetics then they are missing the most important targeting criteria. That is the main point I have been trying to make for a long time.
Acknowledgements.
To Matthieu Landry and Tobias Bamforth (and many others) for many bracing and invigorating discussions. They helped progress these concepts and EagleEye to a higher level and, hopefully in the future, to more documentation of methodology, and finally the mathematics :). Too busy having fun to do it ATM!
Happy vital structuring!
Cheers
Bob Watchorn

