· South America Seismic Tomography – 27 km to 2,850 mm depth
Will now look at South America using seismic tomography.
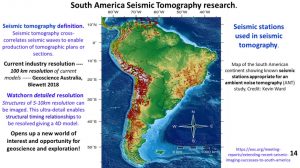
This plan of South America (Ambient Noise Tomography Workshop 2016) shows the seismic stations used to measure the seismic waves which are then across correlated between the hundreds of stations to give a three-dimensional picture of the South American continent. This 3D picture goes right down to the core unlike our other data sources which generally only measure the crust.
In seismic tomography the geoscience industry can only get to about 100 km resolution. I can get down to 5 to 10 km resolution even down at 2,850 km depth.
This ultra-detail enables structures and, most importantly, enable structural timing relationship to be resolved giving a 4D model.
This many magnitudes of extra detail opens up a whole new world of geology and mineralisation right down to the core (and perhaps to the Earth’s centre?).
We will now start to look at South America using seismic tomography data from Vdovin et al., 1999 and Schaeffer and Lebedev, 2013.
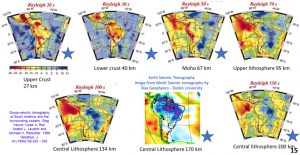
This figure shows the plan databases used to look at the first 27 km of the upper crust and at 40 km in the lower crust. The Moho is examined at 67 km depth.
The central lithosphere is examined at 170 and 200 km depth. These are not super- detailed ideal images to start with but, as we shall see, even with relatively poor images using my enhancement technique ultra-detail can be obtained.
South America Seismic tomography at 27 km depth (upper crust and Chicxulub impact structure)
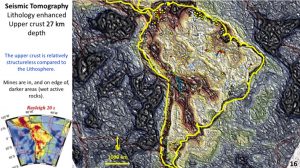
This image of the middle crust at 27 km depth is an example of the enhancement of the original data seen in the bottom left inset. Up to 1,500 km diameter rings can be seen. Often the mines can be seen following these rings or lying within the rings.
The lithologies can be ascertained on this plan. The dark brown of the Andes is upward flowing heat and the dark brown in the centre and north or South America of is of wet slow sedimentary rocks from erosion that form basins. The light brown is intermediate rocks and the cream is cratonic material.
One thing that is noticeable about the location of the mines is that they lie in the dark brown and the light brown lithologies, or more specifically on the boundary between those two lithologies. These are the roots of the continents and is an exploration targeting method that is currently used (Griffin et al., 2013).
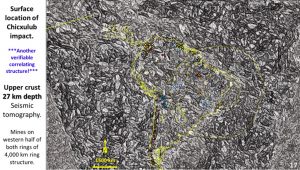
This figure is a much more highly enhanced and shows complex structural geological detail.
It was enhanced to show linear structures and there are huge linear structures seen. There is a WNW structure correlating with the NE coast of South America. It looks like the Western Australian Norseman-Wiluna structure except that it is about 6,000 km long and 500 km wide.
Cross-cutting this structure are later NE structures roughly correlating with the SE coast of South America. The diamond mines lie in the junction of these two major structural directions. This is an exploration targeting tool.
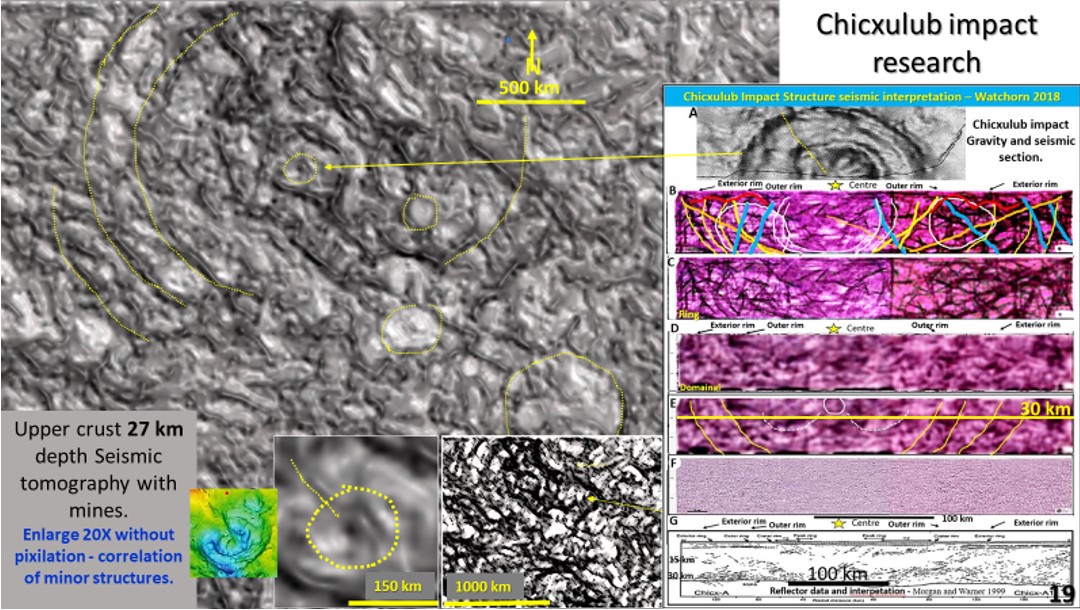
Back on the subject of identifying verifiable structures I noticed in the top left-hand corner of the image remnants of a 2,000 km diameter concentric ring structure. I recognised it was about in the position of Chicxulub Impact – the one that caused the extinction of the dinosaurs 66 million years ago.
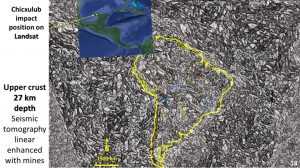
I checked on Google Earth, which I superimposed over the tomography plan, and sure enough Chicxulub was located where the concentric ring structure occurred. Looking at the plan of Chicxulub in the top left hand of the image the outer ring corresponds to the north coast of the Gulf of Mexico.
There has been a lot of discussion on what formed the Gulf of Mexico but there is no doubt from this evidence that it was formed by Chicxulub impact. Because the area is so flat it doesn’t take much movement on the impact rim to; either dam up, or collapse sediment to form the gulf.
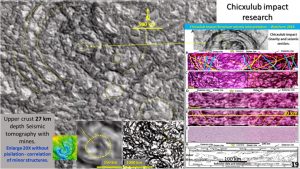
Having a closer look at the centre of this structure it can be seen that the centre is a bowl shape structure about 150 km across. The centre inset at the bottom shows my central structure and how it compares with the left inset which is the 3-D gravity of Chicxulub (Klokoˇcn ́ık, J., 2010). They are identical in the number of rings and even down to the 10 o’clock linear structure in the NW.
I did research on Chicxulub about four years ago and noticed in the seismic sections (right hand side insets) that the faulted lithologies lined up with the rims and that they angled steeply below the seismic section at 60 km depth. Based on this these bowl-shaped faults, even the relatively small Chicxulub impact structures go down a couple of hundred kilometres.
This absolute correlation is further prima-facies evidence for the veracity of the structural geology pattern on my images.
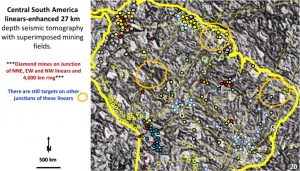
This figure shows in greater detail the linear structures associated with the diamond mines in Brazil and northern South America. The orange rings have similar linear structure intersections to the known diamond producing areas. These would be good exploration targets for more diamonds.
The images you have just seen are most likely the first that have shown the South American upper-crust in such geological detail. The next part of the talk will show the 40 km level of South America in equal detail – further building up the structural geology picture.
If you enjoy these paradigm changing posts share them with your colleagues!!
Happy Hunting
Bob

