Note; this is the first time a detailed structural geology section down to the outer core has been published from the Pacific Ocean to Africa. Figure 62 below is about as good as it gets with the current status of seismic tomographic data – no structural geology is observed. Compare this figure with the following ones using my EagleEye ultra enhancement!
28. South America – Africa seismic tomography oblique section 15°S through 5°N
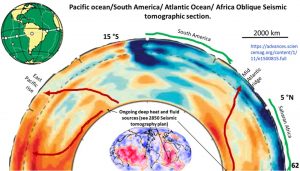
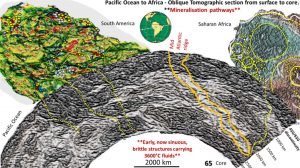
We now look at an oblique section through South America and Africa (Ballmer et al., 2015). The section extends from about Fiji, south of the equator, through to the central Sahara in Africa north of the equator. The section extends from the surface to the core-mantle boundary at 2,850 km depth. It can be seen that there are hotter (orange) layers within the lithosphere. The immovable boundary is the blue lithosphere under South America extending from the surface to the core.
The deep heat sources are shown in the 2,850 km depth seismic tomography core plan in the bottom-centre inset.
In the tomographic section the core heat sources are hypothesised to be where the hot orange lithologies suddenly stop on the core as one goes clockwise.
The red line going through to the East Pacific Rise is the termination of the western high heat area. The same scenario is seen on the right-hand side of the section where the much flatter Eastern heat source under Africa terminates in the Mid Atlantic Ridge. This is the extent of the twisting of the lithosphere over the surface of the outer core over the last 4 billion years – about 5,000 km. Simple math calculation suggests that the surface of earth is rotating 1.25 mm/year slower than the outside of the core at 2,850 depth.
However, the inner core rotates much faster than this (Song and Richards 1996) and has been measured at about a degree every year. The core is supposed to make an extra rotation every 400 years. I have not yet looked at the seismic tomography of the inner and outer core. It should be interesting!
If the different rotations are correct then there should be a big rotation (unconformity) just beneath the 2,850 depth.
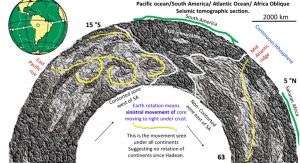
In this enhanced section the 4 billion-year-old immovable barrier of lithosphere under South America can be seen with turbulent flow lithosphere on the left-hand west side and relatively laminated lithosphere on the east side.
The path of the East Pacific rise and the Mid Atlantic Ridge can be seen as light coloured, less textured cross cutting areas extending from the core to the surface. If this is the extent of the Mid-Atlantic Ridge the altered area is only about 200 km in width. The Mid Atlantic Ridge in particular does not seem to interrupt the horizontal laminate structures of the lithosphere. It certainly looks nothing like the vertical gash with vertical lava intrusions as depicted in most Plate Tectonics publications.
Of particular interest are huge downward facing bowl shaped arcs in the far-left, west side, in the centre of the Pacific Ocean. Are these evidence of the planetary impact (University of Munster 2019) in the Pacific Ocean that formed the moon? They lie in about the right position (also see figure 44).
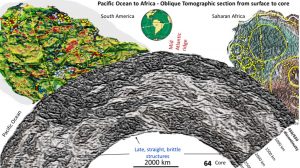
This figure shows the lithosphere between South America and Africa.
The Magnetics of South America with the ring structures and two late linear structures is shown. These late linear structures continue vertically under South America. In fact, they dip slightly west and are dead straight from the crust to the core and cut right through the earlier contorted zone.
This suggests that at least from the formation of these structures that the entire lithosphere between the core and the surface under South America has been rigid.
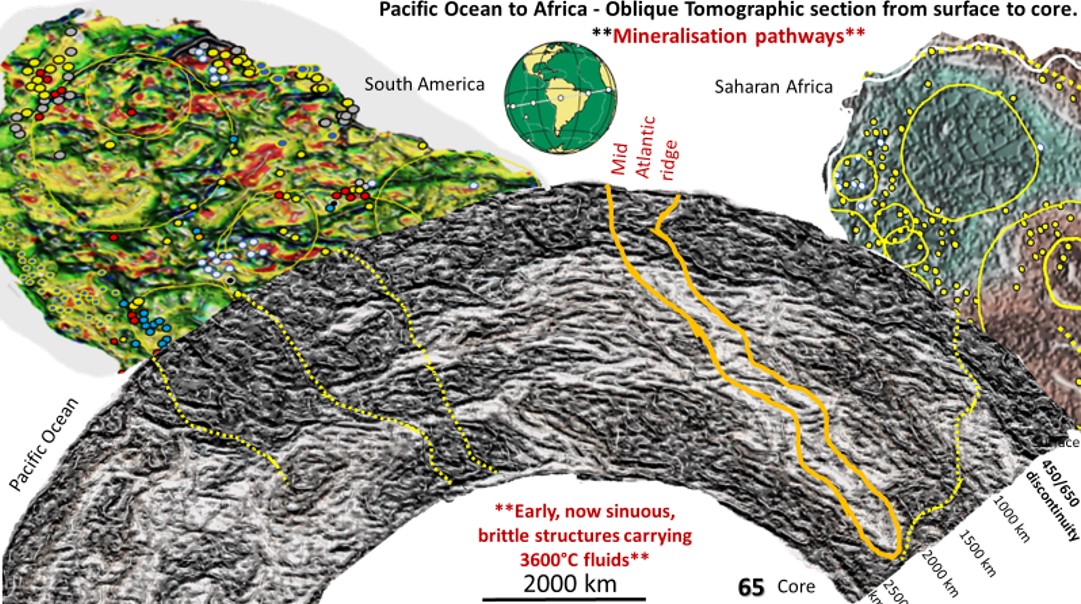
This section shows earlier structures that line up with the mines in South America and Africa. These structures show evidence of movement that is earlier than the straight structures on the previous slide.
They have the same wavy undulating characteristics, right down to the core, of those mineralising shears seen in the first 400 km in the more detailed sections of Australia, Africa and North America.
The extent of the mid-Atlantic Ridge can be seen in the section and there is only about 200 km of separation. It has a flat 30° east dip. The upper lithosphere down to about 600 km appears stretched but not broken by the Mid-Atlantic Ridge.