This post is a continuation of the serialisation of the AusIMM webinar by Bob Watchorn on the structural geology of South America. As such it uses colloquial not academese language. To get the full picture of the startling discoveries you will need to view the webinar video. This video is still not available from the AusIMM who are redigitising their library 🙁
10. Africa – South America – Atlantic Ocean topography
We will now look at the topography from Africa across the Atlantic to South America (Geraldes et al., 2013).
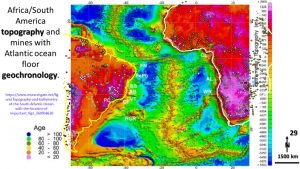
According to the Plate Tectonics hypothesis Africa and South America were joined and separated about 140 million years ago (Algol 2018, Monroe 2008).
The east corner of South America supposedly fitted into Africa’s west corner where Nigeria is located. However, for this to have happened the rate of separation would have to be much greater than the current rate. We know that they did fit together, but when did they separate and how close were they 140 million years ago.
Various databases will be examined in the following section to see exactly what has happened between South America and Africa since the Hadean.
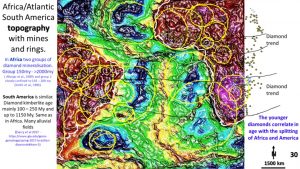
This is the topography plan of South America, Atlantic Ocean and Africa showing ring structures.
11. Africa – South America – Atlantic Ocean topography – Landsat
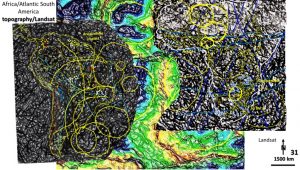
This is the Landsat plan of South America and Africa (Watchorn AusIMM talk on Africa 2020) showing ring structures. Some of these ring structures correspond to the ring structures seen in the topography plan.
12. Africa – South America – Atlantic Ocean topography – Topography
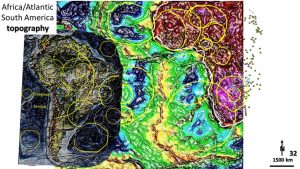
In the topography plan of South America the rings match from central South America to the Atlantic. The large west facing ring is seen on most of the plans that we look at in this section.
13. Africa – South America – Atlantic Ocean topography – magnetics
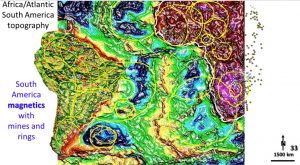
The rings don’t match very well in the magnetics. The surface topography of South America didn’t match the magnetics very well either. The large Araguainha impact was easily seen in the magnetics but not in the topography.
14. Africa – South America – Atlantic Ocean topography – gravity
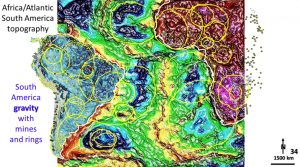
Rings on the gravity plan on the east coast of South America match very well with the rings in the topography of the Atlantic Ocean.
15. Africa – South America – Atlantic Ocean topography – tomography
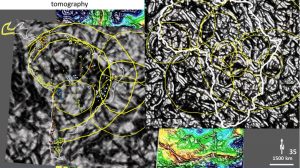
This plan shows the tomography in South America at 200 km depth and in Africa at 400 km depth (Watchorn AusIMM talk on Africa 2020).
The rings from South America extend right out under the surface position of the mid-Atlantic Ridge and shows overlapping rings where the mid-Atlantic ridge should exist.
This suggests that, either the mid-Atlantic Ridge exists only near the surface or that it has a flat east dip. The size of the rings in South America and Africa are very similar and are up to 8,000 km diameter.
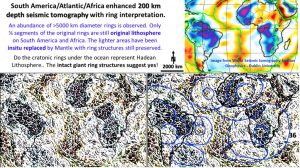
This figure shows the tomography at approximately 200 km depth (Schaeffer and Lebedev, 2013) across Africa and South America.
The tomography was enhanced to highlight remnant cratonic material (grey blue). The lava material coming up the spreading ridges shows as brown with quite a different texture.
The large area of whitish material contains super large rings in both South America and Africa and so is remnant Hadean cratonic material.
On the right hand plan the rings match the rings in the tomography in the more detailed previous plans. The large ring that shapes the NW of Africa is seen as are the large west-facing rings in South America.
As these rings are Late Heavy Bombardment (Taylor Redd 2017) in origin this means that the only movement that has occurred since 4 billion years ago is represented by the brown material between the continents which is, at its widest, 2000 km in width.
This is in complete variance with the current mechanics of Plate Tectonics which assumes that the Earth started with a mobile mantle and a thin easily broken crust. The mechanism assumes that small seed continents were accreted, separated and rejoined multiple times.
The large Hadean rings still observed in this plan are absolute confirmation that this swirling mechanism did not occur.
This plan suggests that the Hadean lithosphere and crust were rigid and that in the last 4 billion years have undergone some brittle-ductile deformation but that the extent of the continent separation has been relatively small.
I’m not sure how this fits with sediment and biological palaeochronology (Meert 2012). I’m sure it doesn’t! However, this is new, better deep, detailed information that is not restricted to the surface 30 km as is the current data.
Why is this better data? If only the crust is used for geochronology then the data obtained is misleading. The crust can submerge and sediments with certain fossils and palaeomagnetism can deposit. This can occur many times to the same area of crust and is thus not a good way to get movement and geochronology indicators.
16. Africa – South America – Atlantic Ocean topography – Gondwana correlation
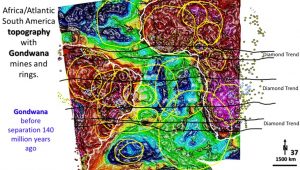
Here I have closed up the South American and African continents to reform Gondwana from 140 million years ago.. It can be seen that the topography rings now overlap considerably proving that the continents were joined before the mid-Atlantic Ridge separated them. Because the Hadean rings extend to the middle of the Atlantic this suggests that the original Hadean continent extended this far also.
Note that the trend of the diamond mines is much clearer now.
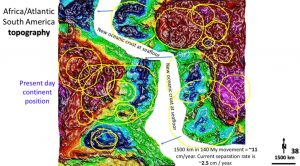
I have separated the continents as they appear today. Why I say that they cannot have separated as currently proposed (where the above sea-level continents were totally joined together) is that the separation rate would be too rapid based on their current separation rate.
Even to move 1500 km apart means that the separation rate has to be 110 mm a year when it is currently only 25 mm a year.
The next post will attempt to see how the current Plate Tectonic hypothesis can fit within all of this new data.

