
This exercise was carried out to illustrate the incredible increase in verifiable data that can be gained, using the EagleEye structural geology recognition system, from colour contoured MagnetoTelluric plans published in the LinkedIn post of Dr Naser Meqbel in November 2021.
The above plan shows that the structures the mines lie on are clearly observed in plan, and most importantly, in section. There is no other geophysical system currently available that can give this ultra-detail. This has huge positive implications for exploration targeting, which is the purpose of my research.
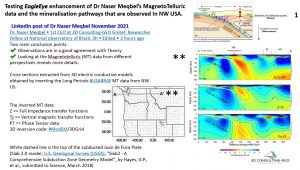
North America. MagnetoTelluric sections from Dr Naser Meqbel’s LinkedIn post in November 2021. The three sections use different filters for the same section. The top section was used in this study.
The section position is on the west coast, right up near the Canadian border, and so in the following illustrations of the plan and section of USA has to be turned upside down to correctly view the plan and section isometrically.
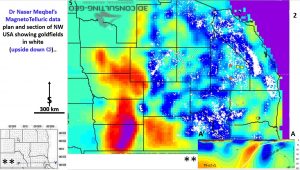
This figure shows the North America MagnetoTelluric plan and section, plus goldfields, from Dr Naser Meqbel’s LinkedIn posts of November 2021. The section is to scale and in as near an exact position as possible.
The very thin surface section of the crust has strong horizontal geology and so does not match the geology in the section very well. I have noticed this feature all over the world in my research.
This illustrates the problem with most current geoscience research that uses surface geology to explain the evolution of Earth and the mineralisation process. As will be seen in the next figure that this limitation is no longer a hindrance as I can show you accurate deep geology – in this case down to 300 km depth!
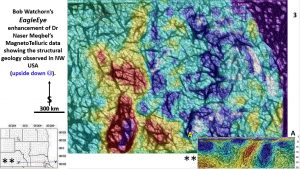
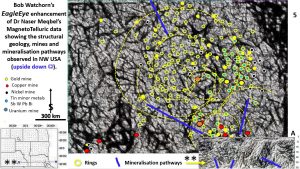
North American MagnetoTelluric plan and section showing structural geology. This is the EagleEye enhanced plan showing detailed structural geology. The MT colour contour values have been overlaid.
We can now start to do some real structural geology using these plans! Being able to use structural geology instead of only using colour contours to represent broad rock properties is an incredible step-up in understanding the complexity of the surface and subsurface geology – in this case down to 300 km depth.
This is the EagleEye enhanced North American MagnetoTelluric plan and section showing detailed structural geology.
The NNW and NNE linears can be traced from the plan to the section. These MT plans are in the correct location and thus verify that these definite fine detail structures are real and thus can be used in 3D structural modeling.
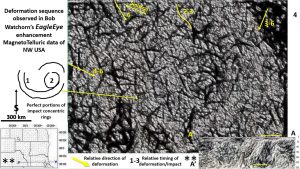
This plan shows nearly perfect, concentric ring structures, or portions thereof (yellow arrow). There has been much discussion of ring structures over the last 60 years, on their reality and if they can be used in mineral exploration. A simple plan like this, and the following plan, shows they are real geological structures (unless you are totally biassed or blind :)) and can be used for geological modeling and in exploration targeting.
Many layers of structural geology can be seen and thus they can be used for geochronologically defining deformation sequences. Thus these structures can be used for proper 3D modeling and continental scale research into the North American continent’s evolution.
A provisional structural deformation sequence for Western US would be;
1- 2. Concentric Ring Structures. At this size (1,200 km diameter) and early formation they have to be LHB impacts. If so how have they remained portions of perfect circles since their formation from 4.1 to 3.8 billion years ago? This suggests that there has been no movement of the North American continent since then?? This accords with my research and suggests the current Plate Tectonics theory of a constantly moving/recycling Earth is incorrect.
2-3 NNW Flat Z sigmoidally bent ‘finer shearing’. The scale of the individual ‘shears is from 5- 20 km width.
3-4. NNW fracture zones representing ‘large faults’. They cut through the finer shearing. The scale of the individual ‘faults’ is from 10- 50 km width.
3-6. NNE large sharp fracture zones. These correlate with the NNE ubiquitous huge fractures on the world Landsat and seismic tomographic plans from 20 – 2,850 km depth. They are of many generations and are obviously an integral part of Earth’s evolution.
4-6. WNW large sharp fracture zones. These correlate with the WNW ubiquitious huge fractures on the world Landsat and seismic tomographic plans from 20 – 2,850 km depth (Tethyn Spiral). The scale of the individual ‘faults’ is from 10- 50 km width. They also are of many generations following the same trend, and are obviously an integral part of Earth’s evolution.
That is a start and a challenge!! There should be plenty of geoscientists wanting to take this sequence further??? However, you should realise that this is the only data on Earth that you can currently perform this relatively (but profound) simple structural sequencing on. Sad isn’t it? With all of the trillions spent on geoscience and exploration over the years!
Now let us look at mineralisation controls.
This is the EagleEye enhanced MagnetoTelluric plan and section of North American detailed structural geology with the main mining fields overlaid.
The linears correlate in plan and section and the linears with the mines on them are the mineralisation pathways. Even the oblique WNW linear has a strong expression in the section. Follow these for exploration targeting! I won’t even mention that the concentric ring structure, abutting the left-hand side of the section, correlates with down facing arcuate features in the section 🙂 .
The above plan shows that the NNE and NNW structures the mines lie on can be clearly traced from plan to section. There is no other geophysical system currently available that can give this ultra-detail with an exact level and coordinates, or as exact as this geophysically derived data can be. This has huge positive implications for exploration targeting, which is the purpose of this research.
The big difference between current geophysical enhancements and my structural geology based enhancements is that geophysicists model everything 3 paces removed from the real data by mathematical methods.
So, Plate Tectonics is a hypothesis currently based on unfocused unprovable geology. It is the same situation in our current 3D Earth modeling. As the old computer saying goes – unfocused data in, unfocused, but good looking 🙂 , 3D models out.
EagleEye modeling uses more basic methods but obtains real structural geology data. This makes a world of difference as can seen in the deformation sequence worked out from the previous figure.That has NEVER been done before!
My data is real provable geology. The faults are where they have proved to exist, they correlate well from plans to section at all depths, and the mines lie right on them from Kalgoorlie in Western Australia to Bingham Canyon in the US. I have obtained provable fact results in Australia, Africa, China, South and North America and Europe/Asia.
All that aside, the best feature is that these plans can be directly used for exploration targeting.
The method is to search where the mines are on linears, then find where these linears intersect the rings, and then go down to your local scale ranking criteria for further refinement. Even at this semi-continental scale broad areas can be targeted. The giant Olympic Dam mine was discovered in in 1976 Australia by Western Mining Corporation (my old company) by using these methods brought to their attention by Tim O’Driscoll (https://onlinelibrary.wiley.com/doi/abs/10.1111/j.1365-2451.1987.tb00522.x).
Happy Hunting
Bob Watchorn