9. Seismic tomography 300 km depth.
View the webinar at https://www.ausimm.com/videos/community-event/south-west-wageoscience-society—digital-tech-talk-new-discoveries-in-the-structural-geology-mineralization–exploration-targeting-of-north-america/
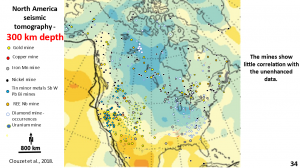
This plan shows the unenhanced North American seismic tomography at 300 km depth (Clouzet et al., 2018). It’s not a very promising looking plan from which to get good geological structures.
When the mines are plotted they do not correlate with any of the contours of the tomography at the surface. When using traditional geophysical methods no structural geology is outlined. We need to see the structural geology!
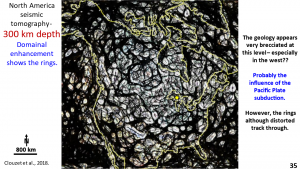
This is the EagleEye enhanced plan of the 300 km depth seismic tomography.
The geology is still very brittle at this depth. rings and linears are plainly observed! How can this be possible as we are supposed to be in the middle of the mobile upper mantle?
There is a lot of detailed structural geology seen. The most obvious ring structure is centered on the Lake Superior area. The most well formed concentric ring in the gravity near the surface is also in this area. Is the surface ring a palimpsest of this deeper ring (McCafferty, 1995).
Palimpsests are formed by later intrusions coming up from the rims and centre of the deeper ring, through the lithosphere, to the surface – creating the surface ring’s structural geology?
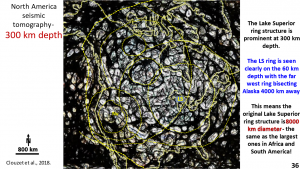
The Lake Superior ring at 300 km depth is huge!
Even though the ring is warped and broken in the west by the Pacific Plate subduction, it is still traceable.
If the western boundary is the true boundary of the Lake Superior Ring then this ring is 8,000 km diameter which is similar in size to the biggest rings in Africa and South America.
As previously discussed in all my webinars these rings can ONLY have formed during the Late Heavy Bombardment period (LHB) from 4.1 to 3.8 billion years ago (Hiesinger et al., 2000 and 2010, Taylor Redd, 2017).
The reason that the Pacific Plate cannot make much of an impression on the shape of the west coast of North America is that the centre of the huge Lake Superior ring would have been filled with lava (Alt et al., 1988. Hansen, 2006. Hiesinger et al., 2000 and 2010. Jones, 2005) probably to a depth of > 50 km thickness.
It would be almost impossible to move or break up and thus the west-coast of the American continent still roughly follows this Lake Superior ring structure.
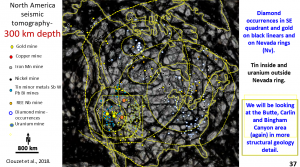
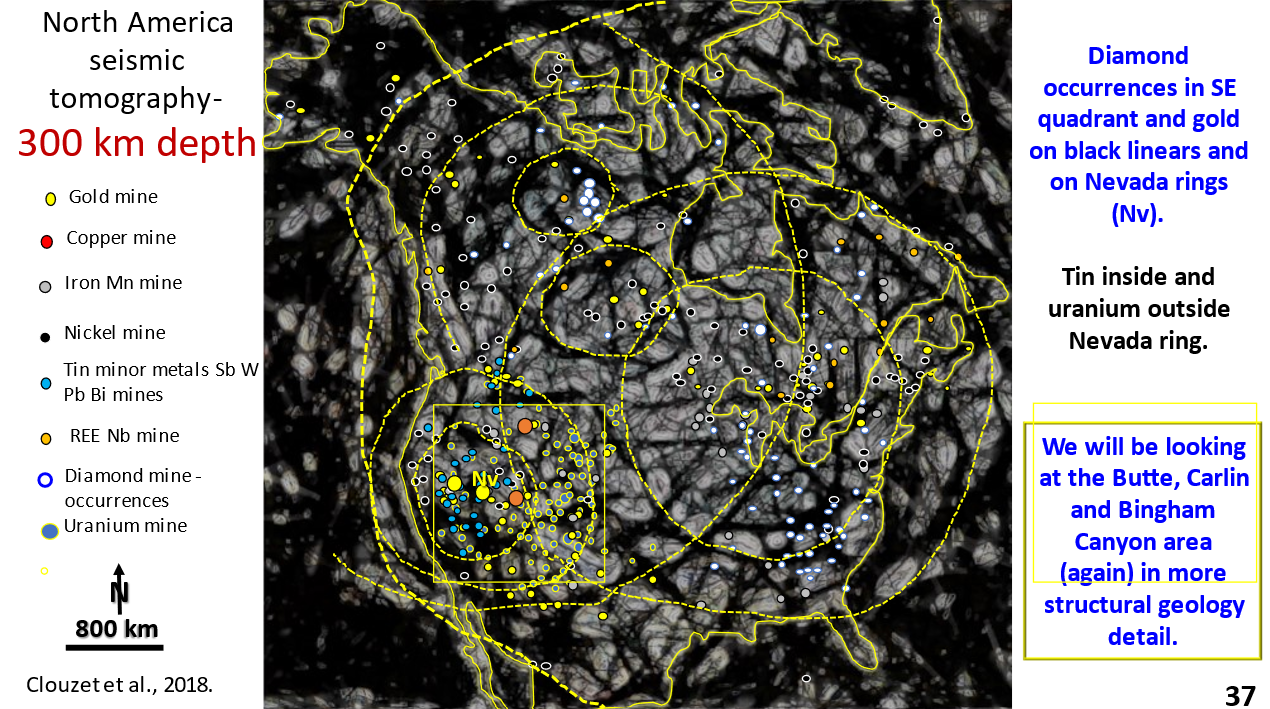
When the mines are superimposed on the 300 km depth seismic tomography it is seen that they have a close correlation to the rings.
The diamond mines in particular correlate better with the rings at 300 km depth than at the surface.
The diamond mines in northwest Canada correlate with the inside of a small ring, possibly the NW ring seen near the surface. The diamond mines in southeast United States correlate with the median ring of the Lake Superior ring. The diamond mines also lie on the NNW trending Diamond Line where it intersects the ring structures.
There is a strong western US ring (NV) in the same position as the Nevada ring on the surface. The Butte, Bingham Canyon, Carlin copper gold mines, uranium, silver/lead/zinc and tin mines all correlate well with this ring.
In the next session we will focus on this Nevada area in the west of the United States which is shown by the yellow box on this plan.
As previously mentioned this was/is the most profitable mining area in North America. If we can crack why these huge mines are there and what structural geology they follow we will have an exploration plan for finding new fields, in this area and elsewhere in the world!
Share this post with your colleagues.
Happy exploring
Bob Watchorn 🙂

