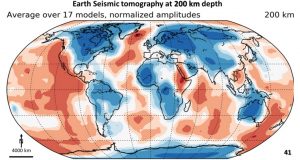
Global tomography at 200 km depth. This is a very broad contour plan (Submachine web based tools https://www.earth.ox.ac.uk/~smachine/cgi/index.php?page=mean_maps).
This is a slightly enhanced plan designed to retain the rock characteristics. The blue grey is cratonic material and the brown is either surface sediment or from heat from the deeper lithosphere altering the deeper lithosphere.
Part of a large ring structure can be seen bordering China and Russia in the east and other ring structures correlate with those observed in the other continents I have researched.
This plan has been optimised for ring structures. Many ring structures can be seen. There is a large one over China and Russia (toggle figure below). The west facing ring in South America is seen. The large ring in North Africa extends right up to the north of the British Isles and joins onto the rings in Scandinavia. There’s a large ring sitting under the Indian Ocean.
Figure 44. Global Earth Seismic tomographic plan at 200 km depth enhanced to show structural ring domains. The rings and continents are overlain.
This plan shows the ring structure’s correlation with the continents. It shows the African Sahara super- ring extending past the British Isles. Another really large ring is situated off the south of India where there is a huge gravity low. Will have a look at this later when we look at the Indian subcontinent.
One thing that I have noticed, from the smallest rings to the largest, is it they form a spiral pattern from the bottom right to the top left of any plan that you want to look at. I’m not sure why this occurs. Tim O’Driscoll reported these spirals in 1980. However, it is the same direction that the Hawaiian hot-spot is travelling. Maybe the rings are preserved when they were formed in the most active tectonic zones in the Hadean and therefore are more filled with lava?
Was the really large ring structure in the Pacific caused by the impact that caused the moon (University of Munster 2019)?
This strongest ring on Earth sits under the centre of the Pacific Ocean on the left side of the plan. I suspect that this is where the Mars sized planet hit earth to form the moon (University of Munster 2019). We can also see the impact of this ring structure at the core-mantle boundary at 1,850 km deep (see figure 44a).
This plan has been optimised for linear structures however ring structures show very clearly.
The most noticeable linear structures actually do follow the WNW trend of the largest impacts maybe confirming the hypothesis that the largest impacts that have been preserved are the ones that had originally Hadean) had the most tectonic movement and lava intrusion.
These linear structures are similar to those seen on Venus, Mercury and Mars. They form an orthogonal pattern and are easily observed. These structures absolutely could not exist, at 200 km depth in the supposed mobile mantle, if the earth has undergone Plate Tectonics movement as envisaged under the current hypothesis.
The Earth’s lithosphere and crust cannot have moved much since the Hadean otherwise these dead straight 20,000 km linears would not be possible. This has always been the big argument about linear structures. Now that they can be seen and plotted that should finish that argument? At least that they exist – perhaps not how they formed.
Unless you can’t see these linears? I’ll bet there are still a few people who profess not to see them!
This figure shows the continents in relation to the large linear structures. It can be seen that the linear boundaries of many of the continents line up with the strongest linear structures. In 1980 Tim O’Driscoll discovered these linears and called them Tethyn Twists. Particularly note the NNW linear associated with the west coast of the Americas. We will discuss this one in detail later.
I’ve tracked the linear structure across from southern Africa across to the north coast of South America and so I know this one is real. There is no doubt that the others are real as well.
In the next session we will compare these linears with those seen on Venus.
