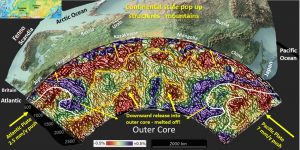
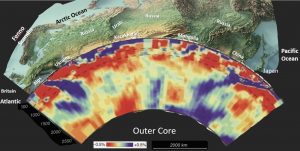
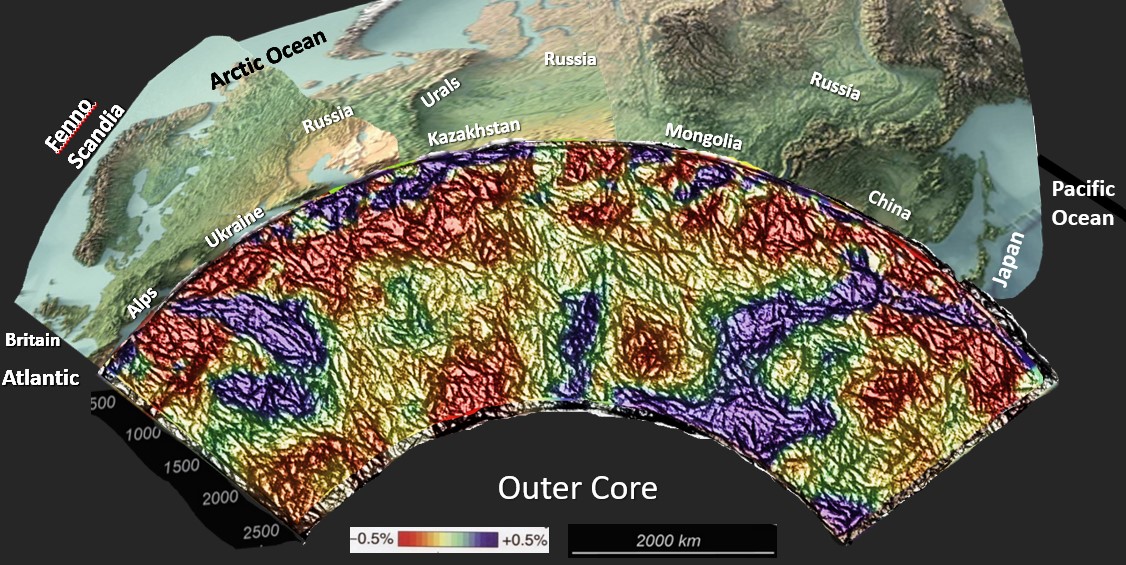
Figure 1 above. Bob Watchorn’s EagleEye enhancement of seismic tomography shows the structural geology of Europe through Asia.
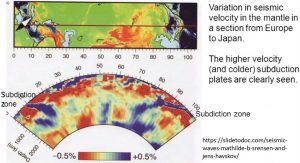
The original seismic tomographic data is from Sorensen and Havskov (https://slidetodoc.com/seismic-waves-mathilde-b-srensen-and-jens-havskov/ and the exaggerated topography is from www.etsy.com .
a. Reason for research.
I will be presenting a webinar in November 2022 on the discoveries relating to these Eurasian structures in both plan and section. I will be correlating these with existing mine and energy resource locations and providing exploration targeting plans as I have done for all of my research. However until November I will keep my powder dry :).
My information sources tell me that these exploration targeting plans are well used!
b. Preliminary results of Eurasian research.
There are linear and arcuate structures extending from the surface to the Outer Core at 2,850 kilometers depth! This is totally new structural information for Eurasia! Is it correct??
It is suggested that this is the first detailed structural geology cross section from under the Eurasian region. I have not found another online??
Thus there are no other structural geology cross sections to compare these results with.
The figure below illustrates the forces and stress directions that I suggest the Eurasian continent has undergone.

This figure is my interpretation of the forces and stress directions that the Eurasian continent has undergone. I don’t think that these ‘forces’ are disputed?Thier magnitude is shown in the left-top inset.
However, they haven’t been shown graphically before as structural geology outlines – unless I’m mistaken?
The above structures are nearly identical to those seen on seismic tomography cross sections beneath Australia, Africa, China and North and South America (see posts below). So, if I am incorrect in my enhancement methods I have been consistently incorrect over 25 years 🙂 .
Astute geoscientists can correct me by showing plans with deep subsurface, detailed structural geology. I have issued this challenge over many years and it remains unanswered.
Worldwide, these structures in cross section correlate with surface structures and also with the controlling structures of the giant mining districts, as I have shown in many posts (see below – again).
Click on each of the posts to get a detailed overview of each area.
My complete series of AusIMM webinars can be found at https://www.youtube.com/channel/UCNCLMIJcW7m_lAFfGF0PS9g/videos.
This is the best – but time consuming – way to get an overall synthesis of my research discoveries around the world – and their exploration targeting connotations.
Geologists that like to think ‘outside the box’ could view them instead of the late night news 🙂
The data used for the above enhancement is shown at the end of this post.
Cheers and here’s to successful exploring!
Bob Watchorn
c. Comparison of structures from other continents.
South America – Africa seismic tomography section 26°S. AusIMM webinar part 13.
CN #1. China Geology. North China Archaean Craton research using seismic tomography. © Bob Watchorn.
Australian Lithosphere research, seismic tomography of Archaean cratons from -75 to – 300 km depth
d. Data used in Eurasian continent research.
The figures below show the original data used in the EagleEye enhancement.


