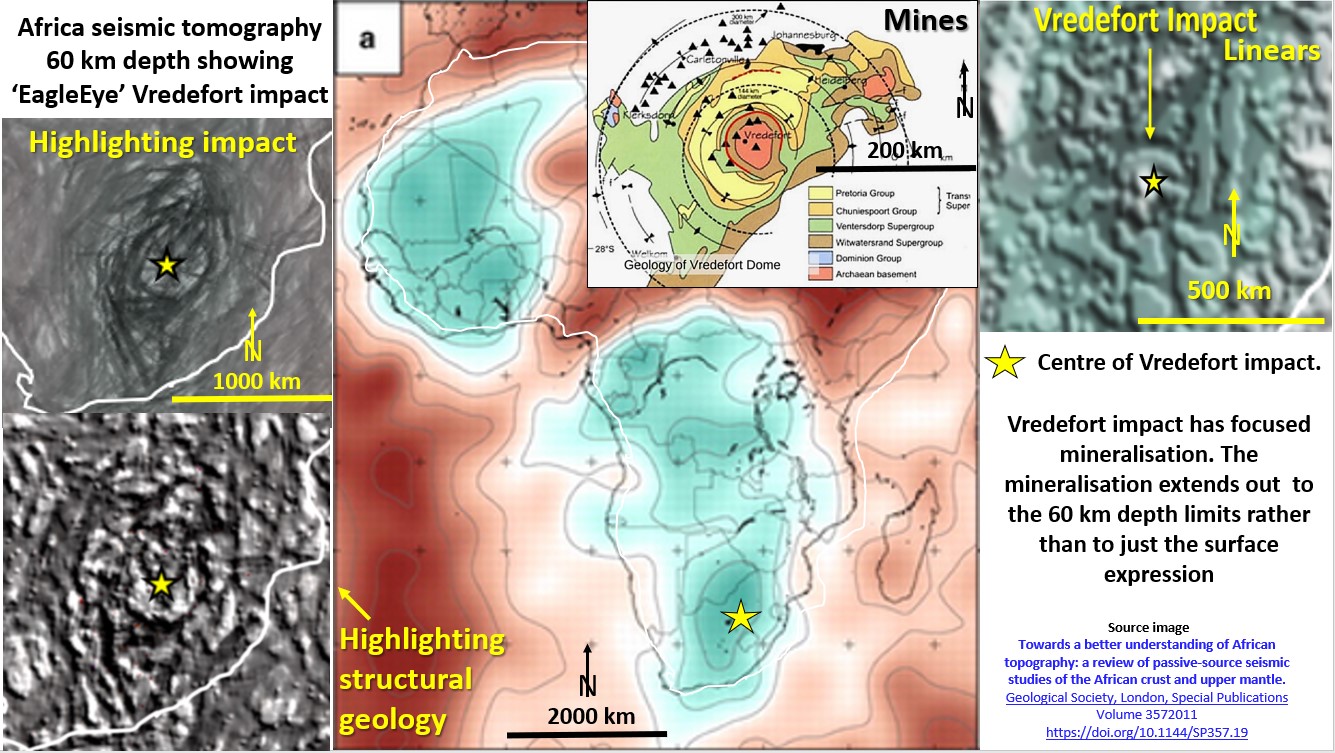
Bob Watchorn’s EagleEye technology has conclusively defined well known identifiable structures which are shown below in 2.5D .
My research is done mainly for the economic benefit of exploration targeting.
Through using structural recognition and enhancement software (similar in concept to medical MRI scanning software), structures from the surface of the Earth to the Inner Core have been defined.
Current geophysical techniques (especially in seismic tomography) use a system of filtering and edge enhancement to define the differences in rock properties. All that is generally produced is a colour contour plan of the area – see central image in figure above. From this colour contour plan geophysicists strive to discern the rock rheology and morphology of a rock under high pressure and temperature which are both unknown but estimated.
Therefore, geophysicists make an assumption of an assumption to define the structure and properties of the inner (and even outer) Earth.
Regarding the mobile mantle, there is an assumption that because the rock at, say 200 km, is at a certain temperature and pressure that it should be able to flow. However, here is no absolute evidence that it does flow!
There is no direct definition of geological structure which is the best way to define a rock’s rheology and morphology. Only the rock’s structure will indicate its plasticity or otherwise. Thus, the foundation assumptions of Plate Tectonics are only assumptions of assumptions and the whole edifice is on shaky foundations.
Let me be quite clear, I’m not against the overall operation of Plate Tectonics but can see that if the base foundation principle of a Mobile Mantle is wrong then Plate Tectonics must operate differently.
EagleEye enhancement defines rock structure and from these structures the properties of the rocks can be more accurately defined.
At all depths to the Outer Core there is no structural geological difference. Thus the oceanic ‘plates’ and the continental plates have the same geology under the very thin surface crust and Moho.
The observation that there is no change in the density, morphology, size of the rings or world spanning linears from the surface to 2,850 km depths suggests that there is no mobile mantle as currently postulated!.
This is in such complete contradiction to the current Plate Tectonics Theory that some skeptical readers have decided that none of my structures are real. For, if some structures are real then why aren’t the other, obviously embarrassing, structures real as well.
To those skeptical geoscientists I say, if the known surface structures that I clearly outline, such as the ones below, are shown to be real, then there is no reason to disbelieve the buried unknown structures just because they cannot be seen and that current techniques can not outline them – yet.
As Molly Meldrum (Australian joke) said, ‘do yourselves a favour’ and examine the images below and then see what you believe!
Three well researched impact structures.
Vredefort impact structure.
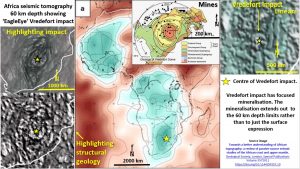
This shows the Vredefort impact structure at the surface (geology and mines) and at 60 km depth and how it relates to the wider geology of South Africa. EagleEye Vredefort structure correlate exactly with the known structure!
Chicxulub impact structure.
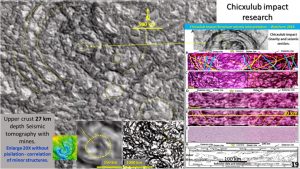
This collage of images shows the Chicxulub impact out to its full extent of 3,000 km diameter. The lower-left images shows the recognised gravity image of the centre and my EagleEye image from 27 km depth continental scale seismic tomography. There is an amazing correlation – even down to the detail of the 10 o’clock arm in each image!
Araguainha impact structure.
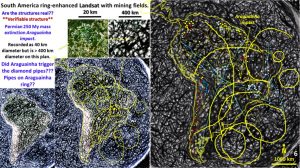
This impact is relatively poorly defined on the surface and yet it had a huge impact back in the Permian when it is believe it caused the great Permian extinction. EagleEye of the same Landsat data suggests that it is a larger impact with an outer ring of 600 km diameter.
African rift system in plan and down to 800 km depth.
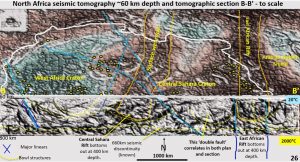
The comparison between the 60 km depth seismic tomography plan and the 800 km deep seismic tomography section is startling! The African and East African rifts line up in plan and section. The ring structures in plan line up with down facing arcs in section. The most convincing evidence that the structures are real is the double NNW trending fault line in the right-centre plan lining exactly up with the only steep east-dipping double fault line on the section.
Atlantic Ridge down to the outer core in seismic tomography section.
South Atlantic.
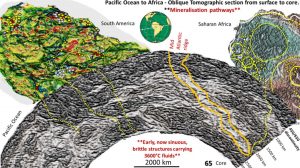
The Mid Atlantic Ridge is narrow and dips flatly East! It looks nothing like the almost vein type opening mechanism depicted on current geology plans. Structures of all ages travel straight through to the core suggesting a brittle mantle. This is the first structural geology plan of the Mid Atlantic Ridge!
North America, North Atlantic, Europe to Africa structures to core.
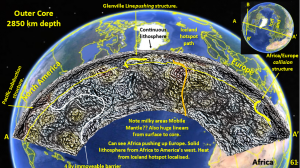
The structures that are known to be real and outlined on this section are the African/Europe collision zone (right), the Mid Atlantic Ridge (centre right), the Glenville line (centre right and the Pacific Plate
Subduction zone (left).
Pacific plate subduction under the west coast of South America in section.
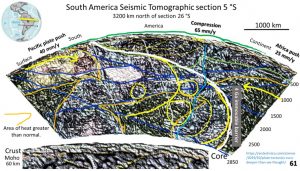
This section shows the subduction zone in graphic detail. It is contorted brittle flow like a glacier. There are structures of all ages traversing the subduction zone from the surface to the Outer Core.
The detail section underneath shows the power of EagleEye to get good detail from continental scale original data. I’m sure this is the first time anyone has observed the structural geology of the South American crust and upper lithosphere down to 200 km depth! Right???
The Yilgarn Craton, Norseman Wiluna intensely mineralised antiform in plan and section.
https://www.geotreks.com.au/work/giant-ring-structures/yilgarn-craton-tomography/ and https://www.geotreks.com.au/work/giant-ring-structures/yilgarn-geology-tomography/
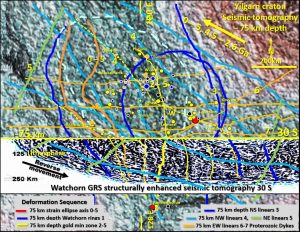
The rheology and morphology of the structures in the Yilgarn Craton are so well defined in this image that their relative geochronology can be estimated. Note the mines following the dark shear zones and how these mineralised shear zones line up in plan and section. These shear zones are some of the most explored and well known in the world and they are exactly where they should be on this plan. Yet more coincidence? I don’t think so.
Stawell goldmine in Victoria, Australia, in 3D magnetics inversion cross-section.
Stawell cross section 300.
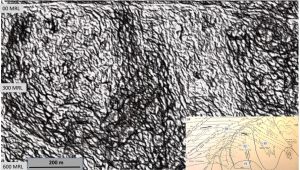
From 1982 to 1986, while completing an MSc on the Stawell mine and district, I postulated the mine scale structures shown in the lower right-hand inset which is a figure from the MSc. These structures were later found by drilling and mining. Recently, using EagleEye on broad scale 3D inversion magnetics, these verified structures which had been postulated in my MSc thesis 36 years before were clearly defined!
This is the absolutely best evidence that the EagleEye technology outlines real structures!
There are many more verifiable examples I could show but we’ll leave it there! If you want more proof you only have to ask!
Sooo …. maybe in the light of this totally new, much more detailed, verifiable structural geology evidence, right to the Earth’s centre, we have a lot of re-thinking to do on the structure and evolution of Earth!!
Happy re-thinking for the pragmatic, open minded, innovative geoscientists, and some tortured re-thinking and perhaps homework for the more dogmatic!
Most importantly explorationists, use the my exploration targeting plans to target and pick up ground, as, if the structures and theory are real, the most savvy, early bird gets all the good projects!
I keep a track of who visits my posts and the correlation of visits to my exploration targeting posts and the sudden pegging of broad belts over my target areas is quite revealing. Coincidence?? 🙂
Happy thinking and pegging!
Bob Watchorn

