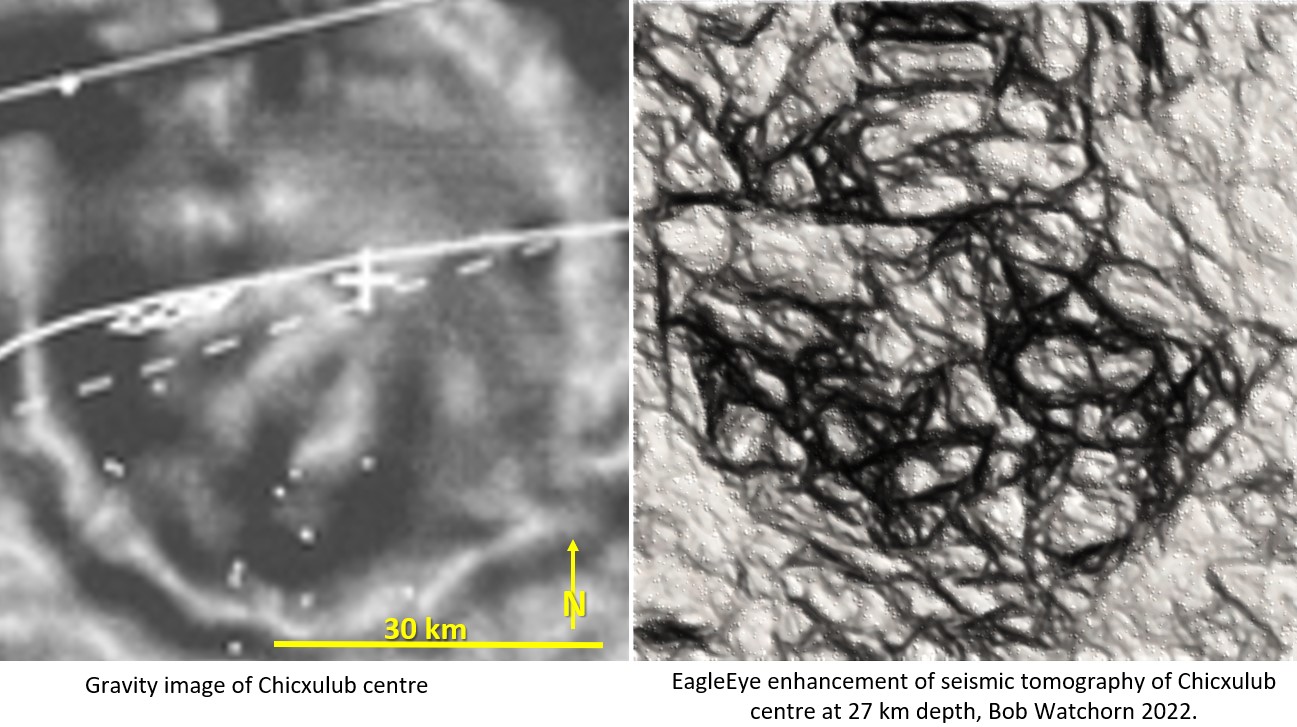
The above figure shows the central uplift area of Chicxulub impact crater.
The left is the standard gravity horizontal derivative geophysical image (Hildebrand et. al. 1998 DOI:10.1144/GSL.SP.1998.140.01.12). It has severe limitations and usefulness. This image shows no fine scale structural geology and is typical of most geophysical images if they are magnified beyond their limits. This image was gained from a dedicated gravity survey over the impact crater.
The right image is the Watchorn EagleEye image enlarged from an old continental scale seismic tomographic plan (Vdovin et. al. 1999) . The original image was a colour contoured image of dimensions of 10,000 km top, 6,000 km bottom and 11,000 km high (an area of 176,000,000 km2. This detail has been obtained over an area of only 30 km x 30 km or 900 km2. This is a huge magnification! And the detail is very good and correlates well with the published geology of the impact.
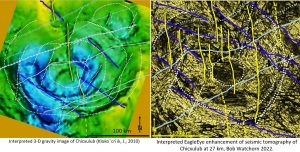
This figure is from my last post and shows the good correlation of the 3D gravity structures (Klokoˇcn ́ık, J., 2010) with the EagleEye seismic tomography enhancement over a 200×200 km area. The area we are looking at now is the small central area of the impact (inside the dotted circle).
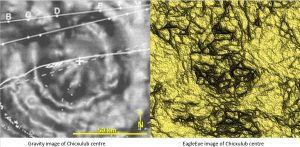
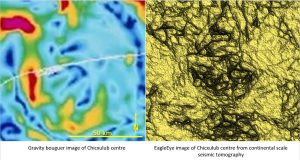
It was mentioned in the last post that EagleEye can be enlarged down to cover small areas and get just as good detail at a scale of 100×100. The result is seen in the two image comparisons above. The detail is actually clearer and once again it conforms to what is known about the geology of the impact.
The left images are of gravity and are the best images of Chicxulub I could get at this scale off the public internet.
The right image is the EagleEye enhancement and there is a vast improvement in detail and clarity of the geological structure. The gravity shows the median ring better and the EagleEye seismic tomography shows the central uplift better.
This may be due to the gravity covering a broad depth and the EagleEye tomography focusing on a specific 27 km depth. Also, the relationship of the various ring structures most likely changes with depth.
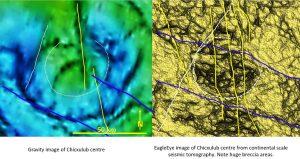
The linear structures correlate much better and most seem to be vertical as they are in a similar position at the two levels.
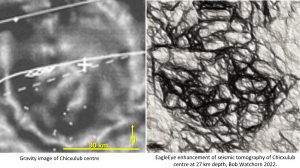
This is the central uplift area inside the innermost ring. As would be expected it shows extreme brecciation! The very sharp ring is inside the median ring of the gravity image and would correspond to the inner ring associated with the central uplift. I have not seen this detail of the structural geology in the core of the impact on any other published image??
This is by no means the most that this image can be enlarged and still keep getting ultra-detail.
The image has been enlarged from a 176,000,000 km2 colour contour plan to a 2,500 km2 ultra-detailed structural geology plan. The power of EagleEye!
Cheers
Bob

