Hi colleagues,
This small post is the first of a few in reply to Tobias Bamforth’s many astute and worthwhile questions (on LinkedIn) on the veracity of EagleEye structures. I’m about to go on a lovely sailing trip on our boat and didn’t want unfinished business to mar it so I dashed this off to lay the ground work for some homework by others!
A good start would be –
https://www.linkedin.com/in/bob-watchorn-97b95624/recent-activity/shares/
https://studio.youtube.com/video/-0Ee7mS18d0/edit
QUESTION – ARE THE EAGLE-EYE STRUCTURES REAL???
Because they are so different (advanced) from what can currently be achieved by geoscientists there has always been much ‘robust’ discussion on the structures produced by my EagleEye method of enhancement. I have always advocated their utter reliability other geoscientists aren’t so complimentary – probably because I’m a stirrer which doesn’t help my cause in the higher planes of learning 🙂
I will start with showing the data trail from the original bland colour contour seismic tomography data (Vdovin,et al. 1999) covering a large part of the Earth’s surface and then show how I can get utterly reliable structures of the well known Chicxulub impact structure, which only covers one 4,400 of the original plan’s area.
Many (most) geoscientists suggest this is impossible – but is it??
Questions to answer for yourself after closely examining the structures.
Does the EagleEye image in Figure 2 represent the Chicxulub impact? Yes or no?
Then calculate the statistical chances of this being the random positioning of structural artifacts generated by the EagleEye methodology! High or low probability?
If the first answer is yes and the second a google number then you have answered the question for yourself :).
You can then with confidence start using (as many savvy mates of mine have been doing, to their profit) the huge amount of data on my website for your exploration planning and bring Australia back to the top in exploration again.
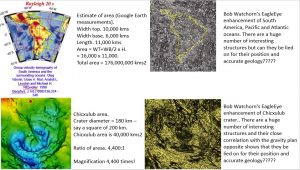
The figure shows the data trail for the exercise.

The top left plan is the seismic tomography plan at 27 km depth that I EagleEye enhanced. It is from the paper –
Group-velocity tomography of South America and the surrounding oceans. Oleg Vdovin,1Jose A. Rial, Anatoli L. Levshin and Michael H. Ritzwoller 1999. Geophys. J. Int.(1999)136,324
The top right image is the EagleEye enhancement. When I looked at the NW corner I saw a partial 2,000 km diameter ring structure. I recognised it was about in the position of Chicxulub Impact – the one that caused the extinction of the dinosaurs 66 million years ago.
When I checked on Google Earth, which I superimposed over the tomography plan, Chicxulub (180 km diameter) was located at the centre of where this large concentric ring structure occurred. To outline, in detail, Chicxulub at this scale from an original image, that no-one can get any detailed geology off, is startling and is the cause of the disbelief of geoscientists!

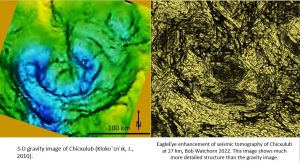
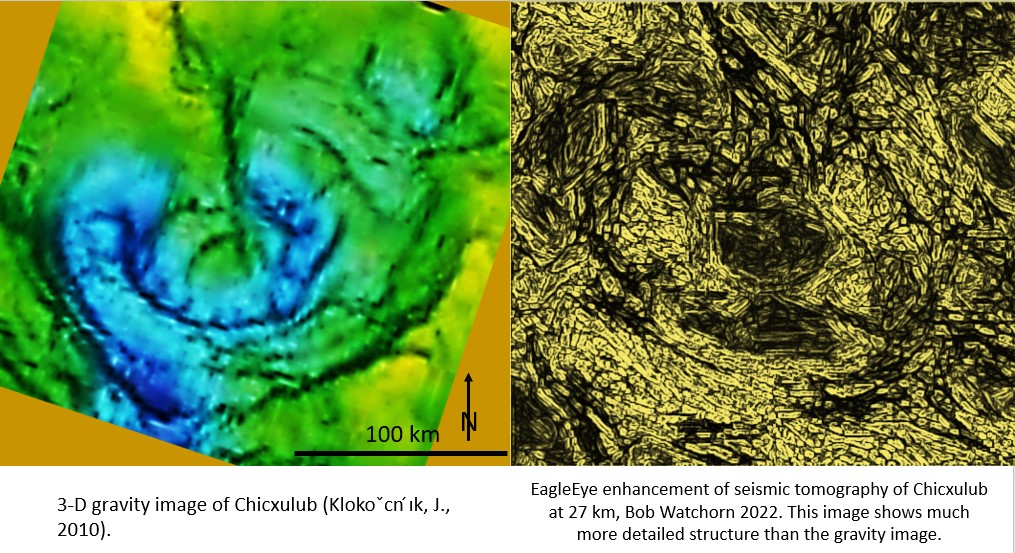
The Eagleleye image (right) shows the central Chicxulub structure and how well it compares with the left inset which is the 3-D gravity of Chicxulub (Klokoˇcn ́ık, J., 2010). They are identical in the number of rings and even down to the linear structure at the twelve o’clock position!
Note that my structural detail correlates but is several orders of magnitude more detailed than the 3D gravity image (got at great expense I’m sure). That’s the best attribute of EagleEye – IT’S FREE!
Having a closer look at the centre of each image it is observed that the centre is a bowl shaped structure about 150 km across. There cannot be a scrap of doubt that they are images of the geology of the same area, the correlation is so good.
WHAT ARE THE STATISTICS OF THIS HAPPENING BY RANDOM CHANCE?
I’m definitely not a mathematician but the probability of one very definite curved structure (say the southern rim of Chicxulub) to correlate exactly with the 3D gravity would be EXTREMELY LOW.
If you count the many individual structures that correlate (the North arm, the disrupted V shaped area in the NNE, the centre of the impact) the probability of this happening by chance alignments of random artifacts would be the GOOGLE NUMBER SQUARED! (look it up)!
How much have I magnified the original fuzzy seismic tomographic data to get this sharp ultra-detailed image?. The difference in areas of the original image and the image of Chicxulub is 4,400:1.
Thus to get the large Chicxulub structure from the original image involves a magnification of the original data of 4,400 times. The actual magnification is many times this as one can see structures 20 kms long and 5 km in width. If it was desired, in exploration, I can keep magnifying in until I could see in detail, through the process of dithering (I’m a first class ditherer:), an area of say 10 km square kms as I have done in Australia and North America.
The above is PRIMA FACIE proof that the EagleEye system produces reliable real structures – in position and with the correct geology. Prima Facie means that unless there is a comprehensive demolishing of the ABOVE EVIDENCE then it is considered true 🙂 . Demolish away!
As always constructive criticism is absolutely welcome and ESSENTIAL!!
Cheers
Bob

