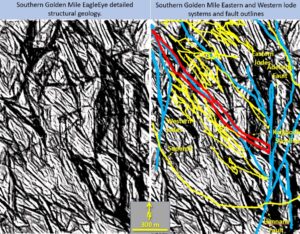
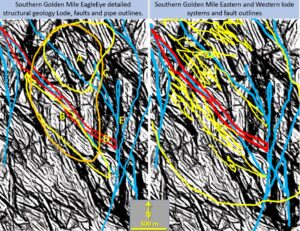
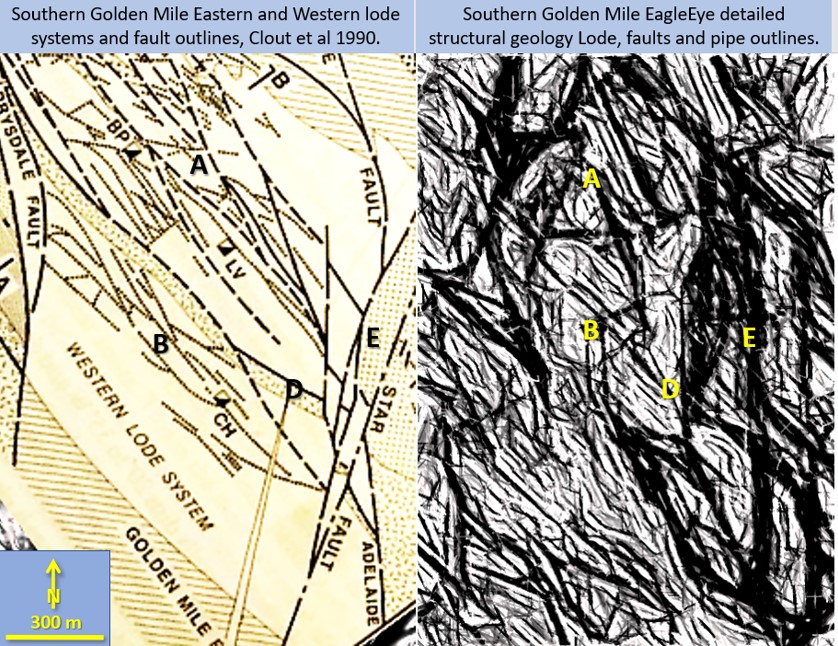
Figure 5n. Kalgoorlie southern Golden Mile published Eastern and Western lodes and EagleEye lode structure correlation.
Objective.
This research looks at the Lode systems of the southern section of the Superpit (Clout et al 1990) at a larger scale of about 1.5 km square. The left image is from the Clout et al 1990 paper and shows the faults and lodes of the southern Golden Mile. The right image is the EagleEye image.
The EagleEye enhancement of 2.25 Km2 is from an Australia wide, colour contoured magnetic survey of low resolution (216 KB) covering about 8 million km2. How can this detail be got from such a unlikely starting image?
A comparison between the image and superimposed lodes and geology is presented below.

The left image is the EagleEye image. The right image is the EagleEye image with the faults, geology and lodes from the Clout et al 1990 paper superimposed. A comparison between the image and superimposed lodes and geology is presented.
Faults.
The Adelaide and Hannans Star faults (blue) at the existing southern cut off of the Golden Mile, which I have mapped on the 12 level Chaffers, are in the right place and quite clear. The NS Adelaide Fault is through-going and is the main fault.
These EagleEye magnetic enlargements show that these major structures are clearly seen in the right position from the local mapping represented by the Clout et al 1990 paper. In local magnetic studies they are not often seen clearly because of the huge magnetic disruption of the treatment plant, pit, dumps and Kalgoorlie city. Thus my EagleEye image could be better than local magnetics images. Point to ponder??
Stratigraphy and stratigraphic structure.
Not much is seen of the local stratigraphic structure. However, the NW trending Kalgoorlie Syncline/Golden Mile Fault is observed (red) from north of the Adelaide Fault to the NW of the image. It is in the correct position.
Lode Systems.
The Eastern Lode system is to the north of the Kalgoorlie Syncline (yellow) and the western Lode System is to the south.
There are 3 main directions of the Golden Mile lode structures.
The NNW Main lode system, NW to WNW Caunter lode system, and EW-ENE Cross lode system. All of these structural directions are represented on the EagleEye image but the scale is too small to see them clearly. We will look at the Superpit area at a larger scale in the next post to remedy this (I got my posts out of synch and that post of the southern end lodes has already been posted – https://www.geotreks.com.au/work/projects-studies/western-australia/kalgoorlie-golden-mile-chaffers-area-eagleeye-structural-geology-and-lode-scale-correlation/ . The lodes correlate fantastically considering the 8,000 X enlargement!)
The southern cutoffs for the Eastern Lode System appear to be NS fault lines parallel to the Adelaide fault.
The northern end of both the Western Lode and Eastern systems terminate on NNE fault lines parallel to the Hannans Star Fault.
The Cross Lodes in the Eastern Lode System parallels strong EW and ENE structures.
The Golden Mile’s most complex and profitable area (greatest ounce / vertical metre) is an area bounded by the Perseverance, South Kalgoorlie and Iron King shafts and the Oroya open pit (left-centre top). On the EagleEye plan this area is easily seen as the most structurally complex with all of the above mentioned structural directions intersecting in this area.
The structural geology of the Golden Mile faults and lodes is fairly represented on the EagleEye plan. This is a good achievement it has been magnified about 4,000 times from the original image which was a 216 KB colour contour image – yet it has orders of magnitude more structural detail.
Quite eminent geophysicists have commented to me that they don’t know how I can do this! I keep repeating that I use Microsoft pattern recognition, edge enhancement, upward continuance, sharpening and contrast algorithms and that they should try and do the same. I’m in the process of showing a few – geologists, I note – not geophysicists – how to do this.
These EagleEye magnetic enlargements show that these major structures are clearly seen in the right position from the local mapping represented by the Clout et al. 1990 paper. In local magnetic studies they are not often seen clearly because of the huge magnetic disruption of the treatment plant, pit, dumps and Kalgoorlie city. Thus my EagleEye image could give better results than local magnetics images? Point to ponder??

The strongest lode area is surrounded by an ovoid (dark line) which is centered within the larger donut shaped ovoid mentioned as the mineralisation pipe in post – https://www.geotreks.com.au/work/giant-ring-structures/australia/kalgoorlie-golden-mile-superpit-possible-conduit-pipes-for-sulphide-and-telluride-mineralisation-exploration-targeting/ .
This suggests multiple pipes within the mineralised area- a more detailed targeting tool?
As the geology of places like the Golden Mile become better known by processes such as EagleEye combined with what we already use for targeting the likelihood of finding another increases exponentially. That is why this new information is so critical for companies like Northern Star, so they can find new Golden Miles before this one runs out.
Cheers
Bob

