1. Abstract
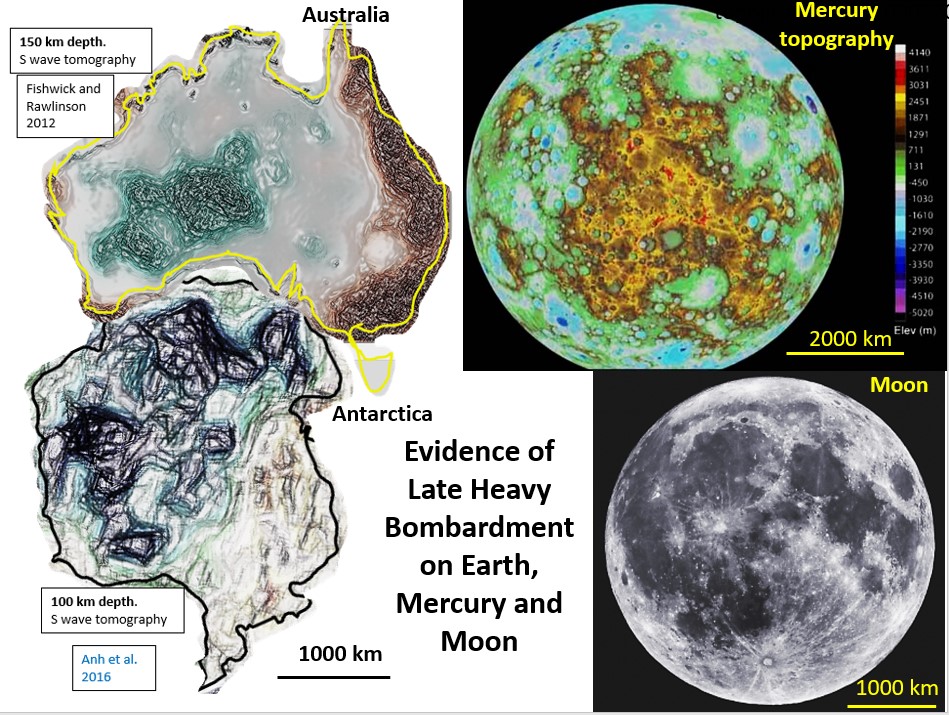
This post continues the author’s structural geology research of Antarctica by examining plan and sectional Antarctica seismic tomography from 30 to 200 km depth and comparing the structures with Late Heavy Bombardment structures on the Moon and Mercury. The structural geology of the Hadean continent of Australia/Antarctica is also hypothesized.
2. Antarctica seismic tomography gives detailed structural geology from 30 to 200 km depth.
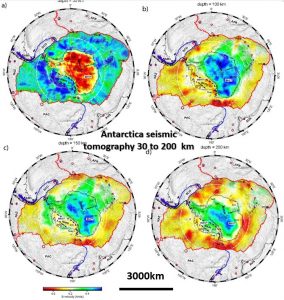
Figure 1. Antarctica Seismic Tomography (S wave velocity (km/s) at 30, 100, 150 and 200 kilometers depth (Anh et al. 2016).
Antarctica seismic tomography uses earthquake seismic waves cross-recorded through recording stations to give a detailed 3 D image of the earth. Like medical tomography this can be sliced into plans and section at any spacing.
This geophysical complexity is suited to the structural geology enhancement methodology used by the author. This paper illustrates the power of enhancing seismic tomography to define detailed geological structure. The Eagle Eye enhancement method gives superior results than current geoscience methods. In medical terms it gives results similar to an MRI compared to the current method which gives results similar to an ultrasound 🙂
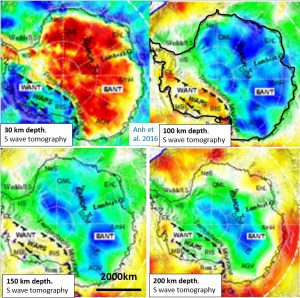
Figure 2. Antarctica Tomography at 30, 100, 150 and 200 kilometers depth (Anh et al. 2016 doi:10.1029/2008JB005787. [Full text] [PDF]).
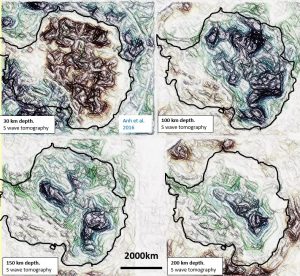
Figure 3. Antarctica Tomography at 30, 100, 150 and 200 kilometers depth (Anh et al. 2016). Structural enhancement highlights the cratonic areas with faster velocity (drier) rocks.
This image has been enhanced using the techniques explained in Watchorn YW #6 under figure 1. https://www.geotreks.com.au/work/giant-ring-structures/watchorn-grs-craton-tomography/ . The enhancement technique, once mastered, is a powerful tool and can be used on almost any image; — gravity, Landsat, magnetics, TEM. Muon tomography, seismic, seismic tomography, radar, geochemistry, topography, botanical, sea temperature, cloud formations — to define the underlying structures.
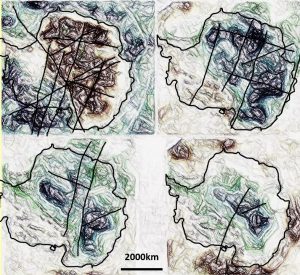
Figure 4. Linears in Antarctica Tomography at 30, 100, 150 and 200 kilometers depth (Anh et al. 2016).
Structural enhancement highlights linear structures within the cratonic areas. The strong linear structures at 30 km depth gradually fade and are almost absent at 200 km. Have they actually disappeared or are they being resued by passive mantle replacement? This replacement must be passive as the giant ring and linear structure outlines continue down in the same pattern into the hotter, wetter lithosphere/mantle at 200 km depth.
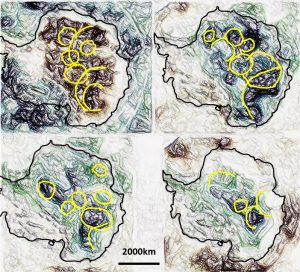
Figure 5. Antarctica Tomography at 30, 100, 150 and 200 kilometres depth (Anh et al. 2016). Structural enhancement highlights ring and arc structures within the cratonic areas.
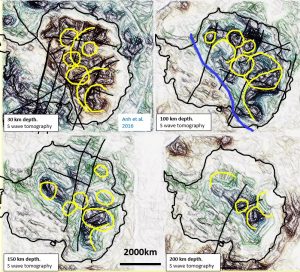
Figure 6. Antarctica Tomography at 30, 100, 150 and 200 kilometers depth (Anh et al. 2016). Structural enhancement highlights linear, ring and arc structures within the cratonic areas.
1. Correlation of Australian and Antarctica Seismic Tomography in plan and section.
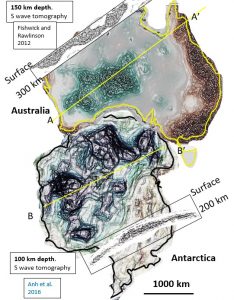
Figure 7. Antarctica Tomography at 100 kilometers depth and in cross section (Anh et al. 2016). Australian Tomography at 150 kilometers depth and in cross section (Fishwick and Rawlinson 2012).
The cratonic areas in Antarctica and Australia are similar in extent and appearance. There is also strong sinistral structural continuity from Australia to Antarctica suggesting that the now separated continents were joined from the Hadean (<4 By) until the breakup of Gondwana (120 My).
The two tomographic cross sections also show similar structural deformation features. The deformation in both cases is sinistral movement from the lower left to top right with the lower left basal area sliding under the upper lithosphere and crust. This correlates with the torsional twist in the Earth caused by the central core of the earth spinning faster than the lithosphere and crust and the base of the lithosphere being pushed eastward compared to the crust.
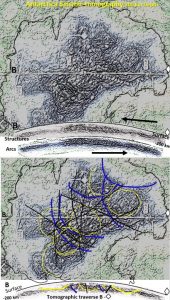
Figure 8. Antarctica Tomography at 100 kilometers depth and in cross section (Anh et al. 2016).
There is good correlation between the detailed structures in plan and section. The sinistral movement (arrows) of the crust over the lithosphere can be seen in both enhancements of Section B. The correlation of the rings in plan and the down-facing arcs in section suggest the bowl structures formed by impacts. Enlarge to 300% to see structures in plan and section.
4. Interpretation of Australian and Antarctica Tomography.
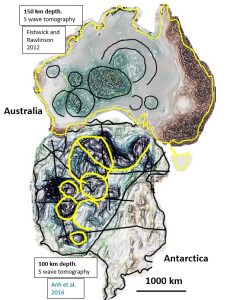
Figure 9. Antarctica Tomography at 100 kilometers depth (Anh et al. 2016). Australian Tomography at 150 kilometers depth (Fishwick and Rawlinson 2012).
These enhancements highlight the morphology of the giant ring structures. They have the morphology (Grieve and Pilkington 1996) of giant-impacts.
The linear, ring and arc structures correlate in orientation, density and size on both sides of the dividing line formed when the continents split apart 120 million years ago with the breakup of Gondwana.
This suggests that the Australian and Antarctica continents were part of one original Hadean super-continent before they split.
The consistent half donut shape of most of the Continental lithospheres may be because during the strain of plate tectonics the lithosphere fractures through the centre of the largest impacts. In the case of Australia/Antarctica this would be in the Great Australian Bight. There is a correlating bight in the top of Antarctica.
5. Correlation of Australian and Antarctica lithospheric structures with LHB impact structures on Mercury and the Moon.
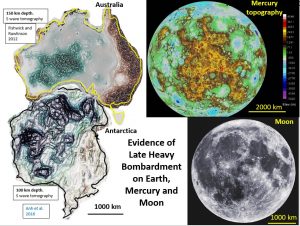
Figure 10. Comparison tomography of Australian (150 km depth) and Antarctica cratons at 100 km depth with Mercury craters (Mitrica, D,. 2016) and Lunar Mares.
This figure shows Moon and Mercury impact structure mares have a similar shape and area to the Lithosphere beneath Australia and Antarctica.
The Moon and Mercury mares were formed by the Late Heavy Bombardment (LHB). The LHB occurred when Jupiter and Saturn swapped orbits causing the breakup of a Mars sized planet which bombarded the inner solar system from 4.1 – 3.8 Ga. There were more minor impacts through to 2.6 Ga (Taylor Redd 2017). There has been no other impact generating event in the history of the inner solar system which could have formed these giant impacts.
The conclusion is that the Lithospheric structures are buried LHB impact structures.
1. Mineralisation correlation between Australia and Antarctica.
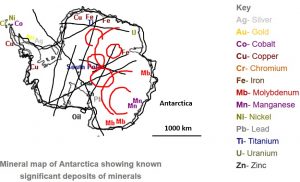
Figure 12. Antarctica broad scale mineralisation plan (Duarte 2015) with superimposed linear and ring structures from the interpreted tomography at 100 km depth.
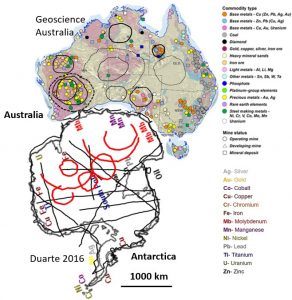
Figure 13. Mineral map of Australia (Geoscience Australia, 2016) with superimposed ring structures from tomography at 75 km depth.
Antarctica has been very poorly explored for minerals because of limited outcropping rock. However, there is good correlation of the molybdenum occurrences on the Antarctica coast adjacent to the southern coast of Australia with the granitic mineralised Archaean (Yilgarn and Gawler) cratons in Australia.
With further enhancement it would be possible to target mineralised areas in Antarctica on the same basis that they have been targeted in Australia (see Watchorn 2019 AusIMM October talk, geotreks.com.au/work/giant-ring-structures/ausimm-innovation/ and Watchorn 2019 paper geotreks.com.au/work/giant-ring-structures/mineralisation-genesis-and-targeting/).
Whether this would be politically acceptable is debatable.
For a more detailed paper go to the attached file —- aaExploration of Antarctica using seismic tomography from 30 to 200 km depth.docx
If you have colleagues that would benefit from a new technique in defining detailed structural geology then share this post.

