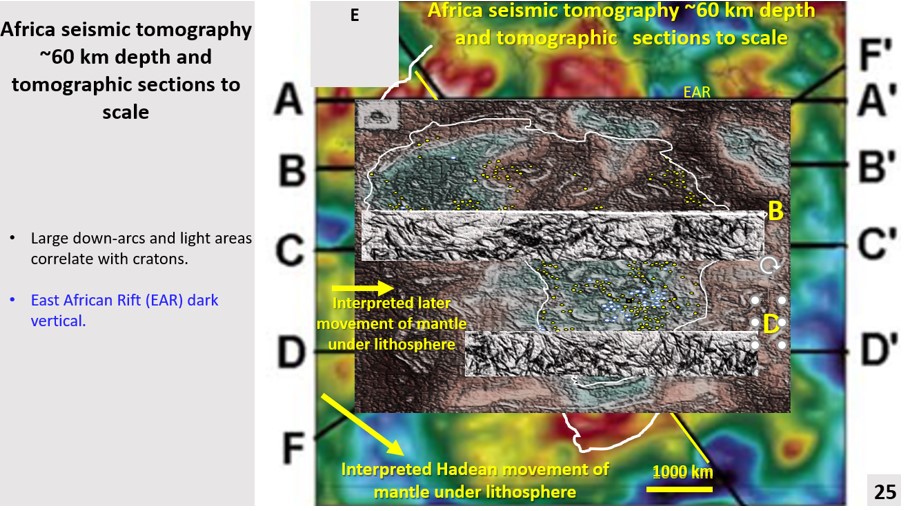
Figure 25. African detailed ultra-tomographic sections B and D and tomography at 60 km depth.
The above figure shows B and D seismic tomographic cross-sections superimposed over the 60 km depth seismic tomography. At this scale the large ring structures can be seen to correlate with bowl-shaped arcs on the sections. It is suggested that these bowl-shaped structures were formed as impact structures (Jones 2005, ) during the Late Heavy Bombardment (Taylor Redd 2017).
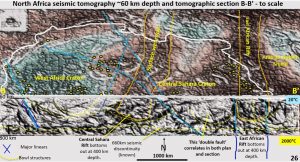
The crust sits on the top of the section and is very thin. The East African rift and the Central Saharan Rift can be seen very clearly. They have a hackly pattern on both plan and section surface and extend down to about 400 km depth. They are failed rifts. They cannot be seen in the lower part of the section.
Once again, the 660 km seismic discontinuity can be seen right across the section as can the bowl structures.
In this section there is good verification that the structures are real in both plan and section. The double fault correlates in plan and section and the orthogonal NE and NW faults correlate between plan and section. The NE fault dip west and the NW faults dip east. This system correlates with the same, or similar fault systems in the Landsat.
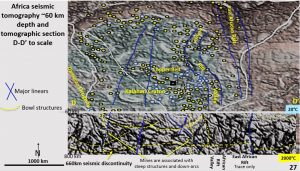
This section cuts across south of the Zambia Copper Belt and north of Johannesburg. The East African Rift can be seen to extend right to the bottom of the section however it is only a series of vertical faults this far south.
The fluid pathways for the mines (vertical yellow dashed lines) are clearly seen on the section under both the Copper Belt and over to the west. They extend the full depth of the section. They are quite different to the orthogonal brittle structures on the section. The bowl-shaped structures (yellow dashed arcs) correlate well with the Kalahari Craton ring structure. That hydrothermal activity is associated with more recent surface impacts was documented by Pirajno in 2005.
According to the current Plate Tectonics hypothesis Africa formed by a series of accretions to this original Congo Craton (Linol et al, 2014, Bercovici et al, 2015). These two sections show unbroken bowl-shaped structures and cratonic material over the entire African supercontinent, therefore African accretion cannot have not occurred in the lithosphere.
Let us now see if this sectional view of African mineralisation correlates with other mineralised areas on Earth?
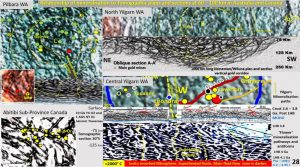
We will now look at the Yilgarn (Watchorn YW #9, 2019) and Pilbara Cratons in Western Australia and the Abitibi belt in Canada to compare these vertical sectional fluid pathways and the correlation of mines at surface with the ring and linear structures at 60 – 100 km depth (Watchorn 2019 a, and Watchorn 2019 b).
The Central Yilgarn in Western Australia at Leonora (lower right inset) has anastomosing fluid pathway structures correlating with the 200 million ounces Norseman-Wiluna gold corridor. The seismic sections (10GA YU02 and 1AGS NY01) of the crust and Moho show deep gold fluid pathways that correlate with flower structures that form under antiforms along this main gold corridor.
This section shows particularly well the total difference in the structures in the top 50 km of the crust (ramp structures), very little structure in the Moho and the very strong structures in the Lithosphere. After I had finished researching from the surface to 300 km depth, I came to the conclusion that at the 300 km depth the lithosphere was partially resorbed and that the resulting fluids had traveled vertically up structures and scavenged and deposited metals as they ascended.
At Wiluna, 700 km further north on the northern section of the Norseman-Wiluna gold corridor (top right inset) there is also a correlating steep well-defined structure extending down 300 km.
In the Pilbara in the NW of Western Australia (top left inset) vertical structures can be seen under the northern extension of the Norseman Wiluna trend. Ninety percent of Western Australia’s iron ore comes from within the wall defined Coonawarra ring structure (yellow dashed rings) seen on the 60 km depth plan. There is much theory as to how iron ore forms. The current hypothesis favours vast volumes of iron silica rich fluids interacting with basinal sediments forming the primary Banded iron Formations (DMP 2020). This correlates with the numerous fluid pathways seen in this image.
In the Abitibi belt in Canada (bottom left inset) the mines lie directly above the structures seen at 100 km depth giving further confirmation of the validity and universality of these vertical structures.
100 – 175 km depth. Two new data sets.
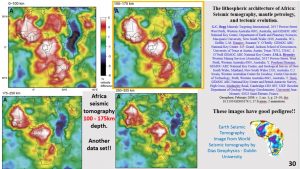
We will now look at the tomography from 100 to 175 km depth. These figures (Begg et al., 2009) shows the tomography of Africa from ~60 km depth to ~300 km depth and shows that the large lighter coloured areas, which are under the surface cratons are located consistently through to the base of the lithosphere.
The data on the left-hand side is from Begg et al., 2009 and is a good dataset. The data in the right-hand bottom corner is from World seismic tomography Dias geophysics Schaeffer, A. J. and S. Lebedev, 2013 and is a course dataset but still gives good results.
There have been unsuccessful attempts to get detail out of this African tomography. My Eagle Eye enhancement method can now get ultra-detail from the seismic tomography and reveals the lithospheric structural geology beneath the Moho for the first time on a public web platform. Share with your colleagues!!

These two images show the different structures that can be enhanced by the Eagle Eye enhancement method.
The left-hand figure is what I call a spider’s web enhancement and shows fine detail on a black background. It shows the ring structures well but also shows more diffuse broad linear structures than the worm image technique. Many known structures such as the East African Rift can be seen, especially in the left-hand figure.
A chess-board of linear structures can be seen, extending from the Egypt/Sahara area to western South Africa, but these do not displace the ring structures so there must have minimal horizontal movement. This supports the concept that the main method of tectonism from 4.5 to 2.5 billion years was Vertical Tectonics and not Plate Tectonics. As well as this structural geology data there is good lithological geological support for this view (McCall 2010 for a summary).
The right-hand figure shows broader detail of the ring structures. A 6,000 km diameter crosscutting semicircle (eastern half of a ring) that extends from the Sahara to South Africa is observed in the bottom half of the figure. This suggests the southern half of the African continent has been one entity since the Late Heavy Bombardment which occurred 4.1 – 3.8 billion years ago. The Late Heavy Bombardment is the only real Earth Event which could have formed this huge ring structure. The large ring in the Landsat is nearly identical and suggests that this ring may have indirectly affected the earth’s surface 150 km above.
These different enhancement techniques have been the result of experimentation and pragmatically following where the images lead. Often good results come out of seeming dead ends. The right-hand image was one such case.
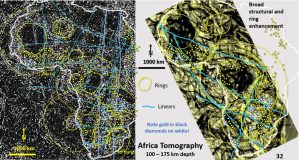
These figures show the interpretation of the ring structures seen in the two enhancements.
Plotting the mines over the rings it shows that they correlate much better than at 100 km depth. They are sitting in the annulus of the rings and at the junction of rings. This phenomenon has been observed in all continents studied so far. Once this relationship has been firmly established and acted upon for mineral and energy targeting a giant leap forward will have been made in exploration understanding and success.
Next episode 5 will be on targeting gold and diamonds in South Africa.
We are now starting to get into the real meaty work that will affect the way we think of the evolution of the Earth and how we will explore for resources in the future. If you want to be a part of this – share this research with your colleagues 😉 🙂

