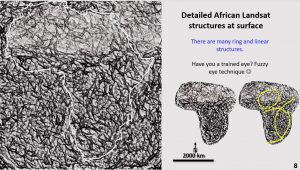
This is a figure of the detailed Landsat structure at the African surface. There are many ring and linear structures observed. This image was mainly enhanced to define the linear structures. The two small images on the right-hand side show that when the images are small, all structures, but particularly the circular structures, are easier to see.
The Landsat or topography of ANY area can be enhanced. I have even enhanced Antarctica’s icecap in Landsat (Watchorn 2020a) and the topography buried beneath the icecap (Watchorn 2020b) with very interesting results!!
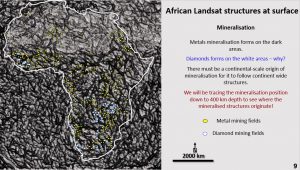
When the mines are superimposed onto the Landsat image it can be seen that the metals mineralisation falls on the dark areas (the faulted, more seismically active) and the diamond mineralisation falls on the light (more seismically homogenous cratonic) areas. There is an excellent mineral targeting tool right there.
The same observation has been made in all the studies I’ve done in Australia, China, North America and Canada (Watchorn, R. B., YW #9, 2019. Watchorn, R. B., 2019. AC # 2. Watchorn, R, B., 2019. CN #1. Watchorn, R. B., 2019. CS #1. Watchorn, R. B., 2019. NA #1. Watchorn, R. B., 2019. FSR #1 Watchorn, R, B., 2019. AusIMM lecture given on the above in April 2019. https://ausimm.com/news/bob-watchorn-tech-talk/ ,Watchorn, R, B., 2019. AusIMM lecture given on the seismic tomographic research on Australia, North America and China in October 2019. https://www.geotreks.com.au/work/giant-ring-structures/ausimm-innovation/ ). I apologise for all the Watchorn references but the fact is that no-one else has done this ultra-detailed Landsat or seismic tomographic research – or at least have not published it on a publicly accessible platform.
We will be tracing the mineralisation down to 400 km depth to see where these mineralised structures originate. Why is there such a good correlation between the detailed structures and the mineralisation at the surface yet the fuzzy Landsat image showed little correlation? What is causing these detailed structures that are hiding beneath the surface?
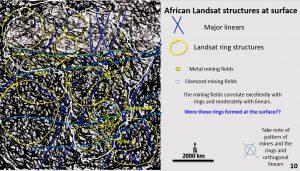
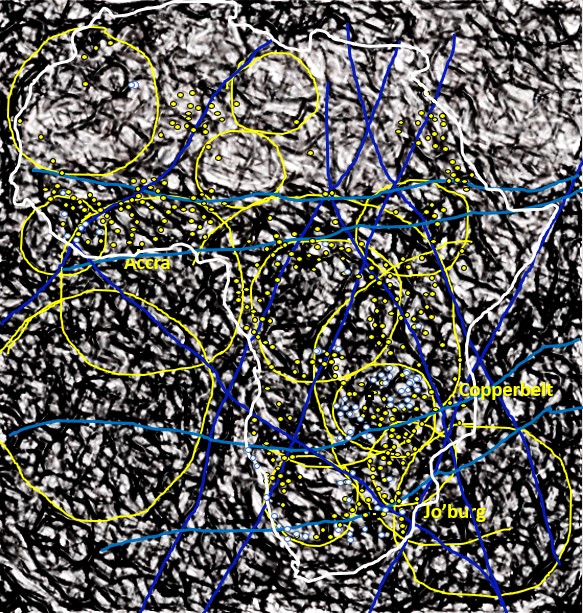
When the linears and rings are superimposed on the Landsat plan it can be seen the diamond mines fall within the large ring of the Kalahari Craton and that the gold mines lie on the edges of the rings and where many rings join. This phenomenon was first noted by Tim O’Driscoll in the 1970s (O’Driscoll 1980, O’Driscoll 1985, O’Driscoll 1986, O’Driscoll and Campbell 1996) and as part of a team effort aided in the discovery, by WMC in 1979, of Olympic Dam orebody, arguably the world’s largest accumulation of copper, gold and uranium metal.
O’Driscoll was decades ahead of his peers and I use the same techniques to get my ultra-detailed images. On the shoulders of giants, we work!
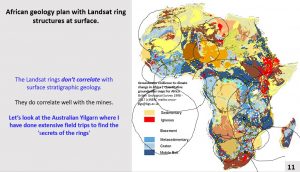
The geology plan of Africa (British Geological Survey 1998 – 2017) doesn’t correlate with the rings obtained from enhanced Landsat. However, the geology does correlate well with some of the mines. So, what are these rings composed of?
We will examine them in Australia where I have done a lot of research in the field (Watchorn 2013a, Watchorn, YW #7, 2019) to see why the rings are visible on the surface, if you know what to look for, but invisible enough so that they are almost universally unrecognised.
6. Comparison of the structural geology seen in the enhanced Landsat of the African continent and Western Australia’s Yilgarn craton.
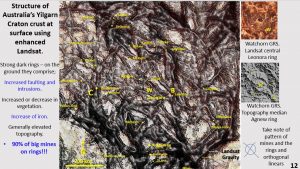
These rings didn’t form on the surface of the Yilgarn as there are no huge areas of shock deformation structures (Grieve and Pilkington 1996, French 1998, French and Koeberl 2010) at the surface, that would suggest the formation of the 800 kilometre diameter rings.
So, where and how did they form? There is an Archaean Breccia pipe near Leonora that lies on the Leonora ring that has confirmed shock deformation structure breccia clasts (Glikson et al, 2016, Watchorn YW#5 2018). My interpretation of this is that it has been transported up from deep in the crust or lithosphere.
When I studied these up to 800 km diameter rings in Western Australia, I found that they comprised; increased faulting, increase or decrease in vegetation, increase of iron and mineralisation and generally elevated topography. Most importantly 60% of the big mines and 90% of the metal content lies on the rings.
On the right-hand side the evidence for smaller concentric ring structures is shown; top-right, Landsat (Leonora ring 75 km diameter – Watchorn, 2017 YW #1, Watchorn 2017 YW #2, Watchorn 2017 YW #3, Watchorn 2017 YW #4, Watchorn 2018 YW #5).
Lower-right, the 200 km diameter Agnew ring as it appears using a neural network program to enhance the topography (Lambert email 2018).
An important structure associated with the mineralisation is a phi structure (first described by O’Driscoll in 1985 (Lambert 2018) which is a structure similar to the ring and crosscutting linears shown in the lower right hand of the figure. The largest mines fall on both the linears and the rings in the figure.
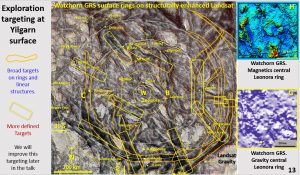
This targeting exercise in the Western Australian Yilgarn highlighted many different targets. The orange shape around the rings is a broad targeting area and where the linears cross are the finer targeting boxes.
There is nothing in the scientific literature anything like this. If you get the Landsat of your area anywhere in the world and enhance it you will bring up a lot of targets.
If you’d had this plan 130 years ago you would have discovered Kalgoorlie and all the big old mines.
If you had this plan 60 years ago you would have found Kambalda, St Ives, the Yandal/Bronzewing belt and the Laverton/Olympic belt.
If you had this plan 30 years ago you would have still discovered the Plutonic, DeGrussa, Gruyere, Tropicana, and Nova deposits on the outer rings and many deposits such as Moolart/Garden Well on the inner rings.
How many mineral fields are yet to be discovered using just this ultra-detailed Landsat?
On the right- hand side are the enhanced magnetics and gravity evidence for the Leonora ring which is the innermost ring of the 800 km diameter Watchorn concentric ring structure (Watchorn 2018 YW #5).
There is an abundance of unequivocal geological and geophysical evidence for these rings in the Yilgarn (geotreks.com.au website for 40 papers on the Yilgarn ring structures and their associated deposits and targeting).

