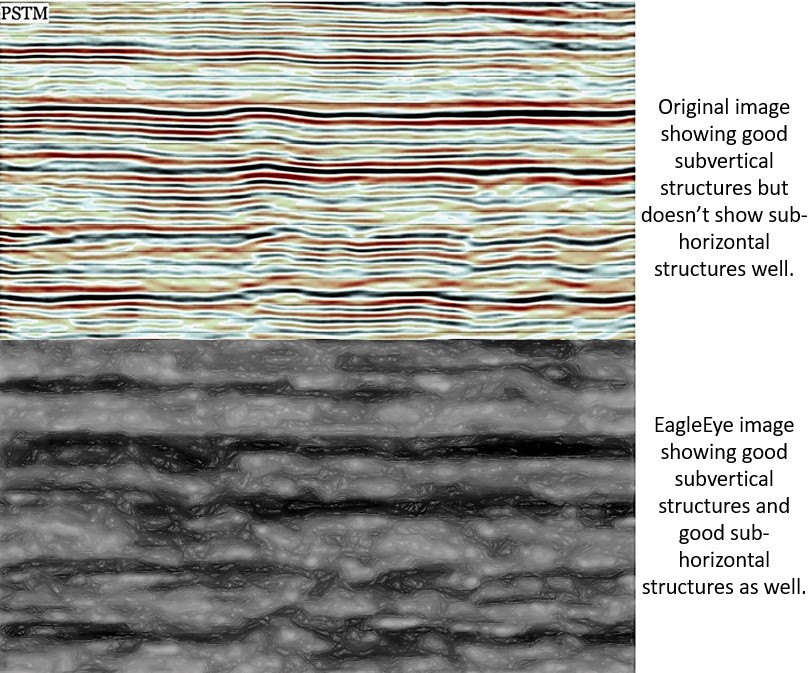
Figure 5. EagleEye image comparison with original seismic from Bill Wepfer LinkedIn post.
I’ve been doing a little research on the original image in Bill Wepfer’s post https://www.linkedin.com/in/bob-watchorn-97b95624/recent-activity/comments/
First I did a bit of basic enhancing (post https://www.linkedin.com/in/bob-watchorn-97b95624/recent-activity/all/) which highlighted the structures a bit more. However the structures I highlighted could be seen nearly as well in the original, as mentioned by Graeme Hird.
So I enhanced the original image again to highlight the flatter structures that are very difficult to see with precision in the normal seismic image because of the grain of the strong horizontal reflections.
The flatter structures are visible. I’m not sure, but I don’t think the current geophysical software can accomplish this task? When I’ve obtained these structures all over the world they have proved to be verifiable.
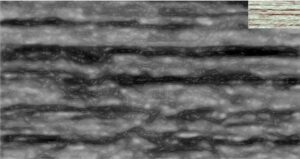
EagleEye image of seismic section optimised for sub horizontal structures. There are strong 40 East and 45 West dipping structures. The vertical structures are not as clear. There is a set of arcuate ramplike structures on the lower left side.
The small top right inset shows the structures on the original image. They correspond to the EagleEye structures. They can be observed more clearly on these small images. The structures obviously have little movement in the observation plane as the stratigraphy is not moved much. This is the main problem with interpreting seismic sections with strong stratigraphic layering. EagleEye cuts through the stratigraphy enabling the background structures to be observed.
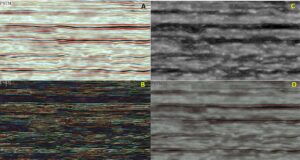
A. Original seismic image. Structures are difficult to see and interpret on this image. EagleEye was used to define the structures more clearly.
B. This figure shows the ending, or less reflectance of seismic units, and also shows subvertical structures (slump?) more clearly. To obtain this enhancement I used an edge sharpening and strong domaining function (like worms) to get the breaks in domains and which also highlights the non stratigraphic, more vertical crosscutting structures.
C. This enhancement makes the image more geologically realistic and this often enables structures (invisible in the very linear seismic images) to stand out. This is how I treat my geophysical (all) data using EagleEye and so far the structures have proved real. I expect these structures are real also. In fact if you interpret the original image most of the steep structures can be seen. Most geologists can interpret the EagleEye type images (they look like rocks we interpret all the time) but not the typical seismic image. This has to be very useful as an exploration tool.
D. Is a 20% overlay of image A over image C. As could be seen in figure 6 the structures correlate with the original but are not easily seen in the horizontally grained stratigraphy. From reading the comments on Bill Wepfer’s original post geophysicists keep explaining that the image needs further process but no-one seems to agree on exactly what to do.
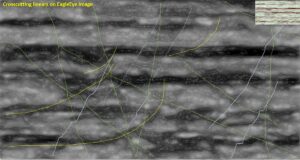
This is a basic interpretation of the main structures seen in the EagleEye image. What these structures represent I’m not sure. They sometimes offset the stratigraphy but usually don’t, suggesting they are late brittle structures with little movement in the observation plane. The ramp like structures in the lower left are interesting??
From reading the comments on Bill Wepfer’s original post geophysicists keep explaining that the original image needs further processing but no-one seems to agree on exactly what to do. All are still going along the same well trod narrow path.
There needs to be a step change in geophysical software so it can do (in proper mathematical fashion) what I can do in EagleEye using Microsoft software??? I’ve started looking at medical imaging software (with the help of Gerhardt Otto). That is the path the bright software savvy geophysicists should go. Look what they can do with similar starting data. Fantastic spinning images, they can slice and dice at will !!
And we are arguing how to get structure from the above very basic image. It makes the mind boggle?!
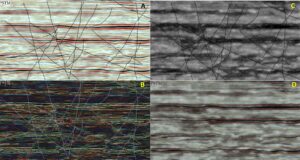
These images are the same as the previous figure with my interpretation overlaid from my structural image. The flatter structures can be seen in all, but much more clearly in my image C. The subvertical structures are seen more clearly in the original and my image B. This is typical of most imaging for structure. No plan will show all structures and the stratigraphy.
Have a good look and as usual questions are most welcome.
Cheers
Bob

