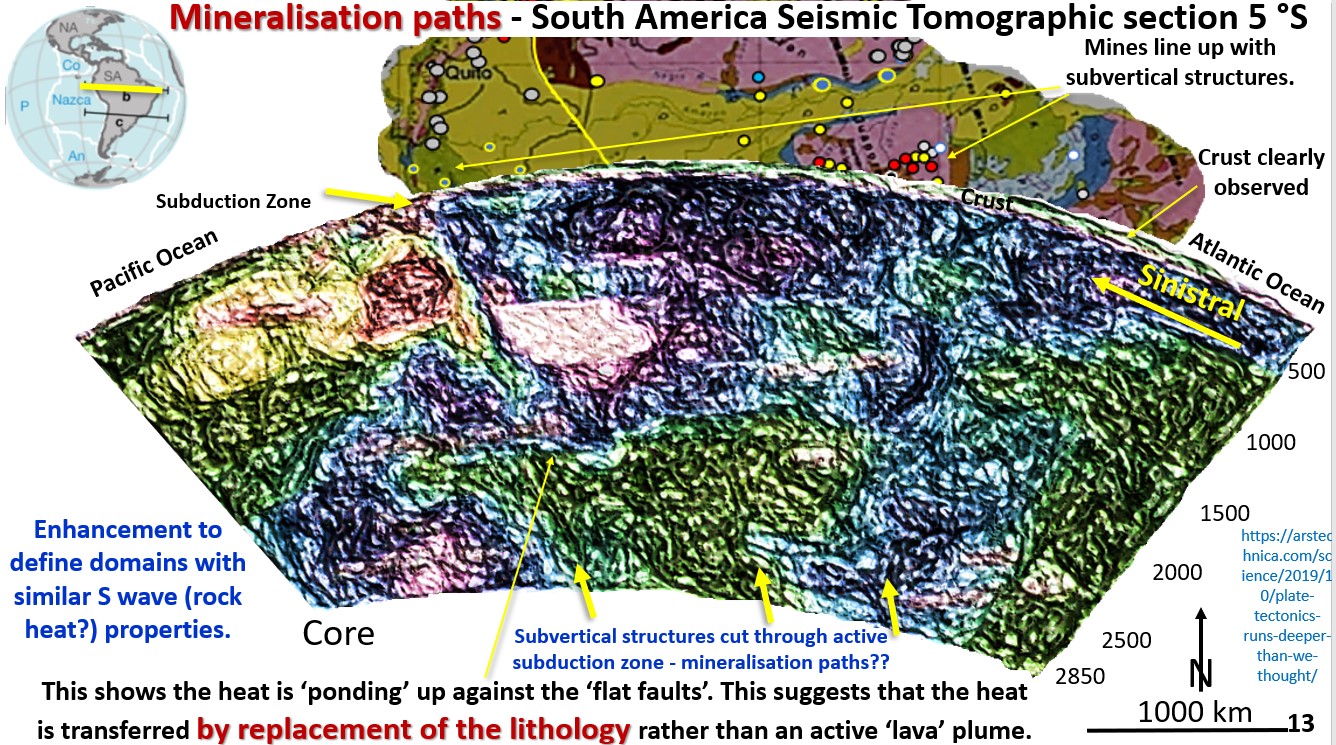
Figure 13. Mineralisation paths – South America Seismic Tomographic section 5 °S.
This figure is of the subduction zone under South America at 5° South.
The current mobile mantle hypothesis suggests that this should be the most mobile and fluid area of the mobile mantle. However, there are brittle structures right from the surface to the Outer Core.
It is seen from the large solid blocks on the section that the movement is not the expected viscous fluid flow but has the appearance of an ice-fall at the end of a glacier with large blocks tumbling (getting pushed) from the surface to the Outer Core.
There is no sign of a viscous fluid motion in a circular pattern within the Mobile Mantle heading back towards the central Pacific Ocean as the Mobile Mantle/Plate Tectonics hypothesis demands. The large surface oceanic blocks remain cool as they plunge straight into the Outer Core.
There is a set of very strong brittle structures (where the yellow arrows point) from the Outer Core through to the surface. The strongest structures are under the mineralised South American fields (mining field centres are the coloured circles).
Where do the metals come from in the Andes and the Rockies along the west coast of the Americas?
Currently it is believed that they come from the upper Lithosphere and Crust and are recycled by the heat from within the upper part of the subduction zone. However, because the subduction zone is moving metal poor oceanic crust it is unlikely to contain large quantities of heavy metals when pushed under the continent. Thus this hypothesis is flawed. This is why I suggest the heavy metals come from the Outer Core.
What mechanism enables these gigantic structures to propagate from the Outer Core straight through to the surface through the eastward moving subduction zone?
The huge pressure from the Outer Core means there is an extensional tectonics regime throughout the subduction zone, and crust, that is more powerful than the eastward push of the Pacific and Nazca Plates. There are many smaller fractures seen extending from the Core to the Surface and these are probably reactivation faults, as each fault makes a new path through to the surface.
One problem with the current mathematical modelling, and the representation of variations in seismic wave velocity as 3-D structures, is that the large reddish hot area in the centre of the Figure 13 would be represented as an upwelling 3-D plume-like structure.
However, this cannot be an upwelling 3-D structure that has any fluid like motion as it is transected in all directions by brittle structures.
The defining brittle structure is the large, flat west dipping structure that extends from near surface under the Atlantic Ocean to 2,000 km depth under the Pacific Ocean. It cuts off the heat from below as the Pacific plate is pushed out eastward, along this structure, over this area.
This suggests that this whole area is a brittle, pop up deformation zone and that the descending oceanic crust has been insitu replaced with hot material from the core rather than by liquid flow.

This figure shows a similar section to the previous one under South America at 5 °S.
Once again it shows the strong radial structures from the Outer Core terminating under the strongest mines in South America. The blue, cooler oceanic crust is plunging straight into the Outer Core as huge, icefall type blocks. They are cleanly cut off by the Outer Core. Elsewhere above the Outer Core there are heated (red) rocks (see figure 8).
The flat west dipping structures extending from the Atlantic to Pacific Oceans under South America are again observed in great numbers.

This figure has been inserted from my Webinar on North America to complete the information on the Pacific subduction under the American Continents. The webinar can be seen at – https://www.ausimm.com/videos/community-event/south-west-wageoscience-society—digital-tech-talk-new-discoveries-in-the-structural-geology-mineralization–exploration-targeting-of-north-america/
This figure shows a seismic tomographic cross section across North America at 36°N (Fuston and Wu. 2020) and its intersection with the seismic tomography at 550 km depth.
The section shows mineralisation pathways from the core with a temperature gradient from ~5000°C at the Outer Core to ~1,800 °C at 550 km depth. These structures are the fluid pathways for the mines at the surface. The coloured circles on the plan relate to the mines at the surface which have been overlaid on the 550 km depth plan.
Once again the flat structures are observed in great profusion dipping both east and west under the North American continent, a perfect continental scale pop up structure! This strongly suggests that the upward pressure from the overpressurised Outer Core is real.
Thus the pieces of the Global Mineralising and Exploration Targeting system are coming together!

