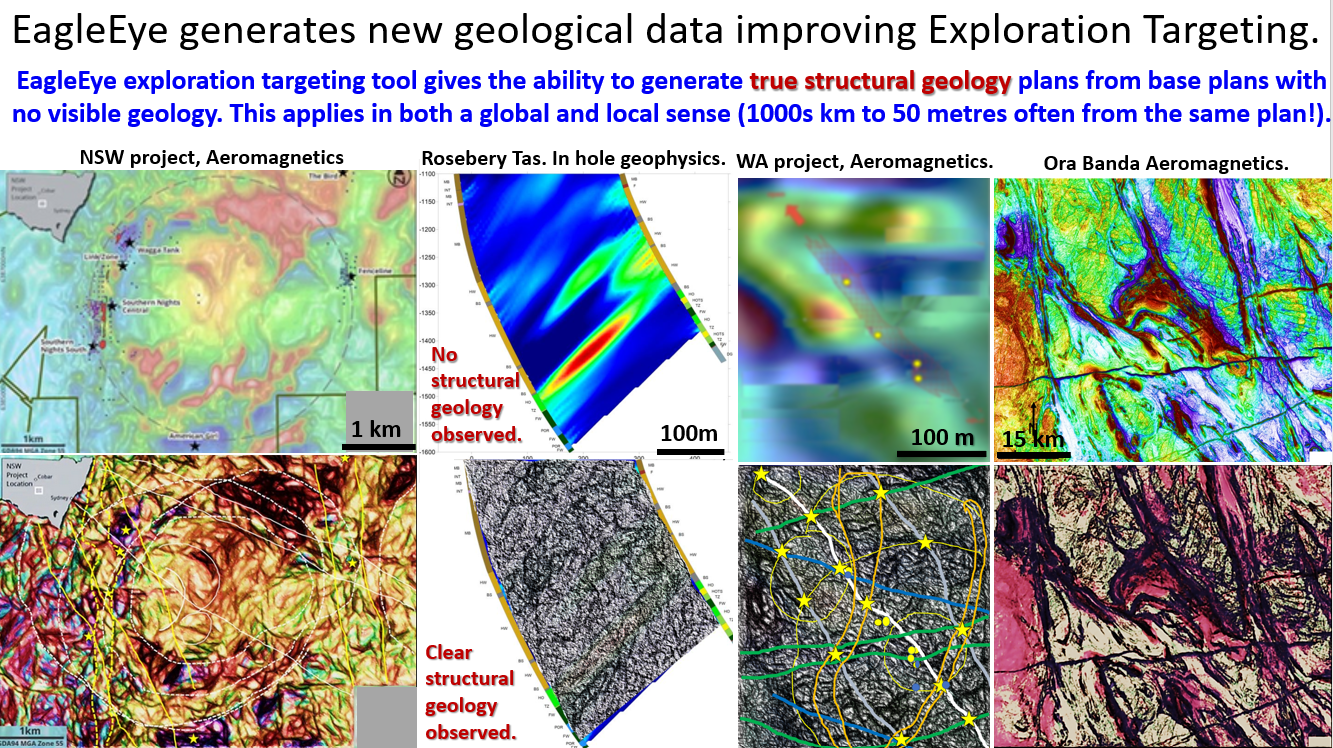
Figure 6 above. Comparison of original images with the EagleEye structurally enhanced images.
The EagleEye exploration targeting tool gives the ability to generate true structural geology plans from base plans with no visible geology. This applies in both a global and local sense from plans thousands of kilometres across to local project data 50 m across.
On the left is a New South Wales project with the original fuzzy plan on the top and the EagleEye structurally detailed plan on the bottom.
The middle-left example from Rosebery Tasmania down-hole geophysics. The top colour contour plan showing the down-hole geophysics shows no structures at all.
The image beneath this is the EagleEye image which shows structural geology which I guess will be found out to be true or otherwise by further drilling or underground development.
The middle-right plan of aeromagnetics over a WA gold project was a very poor image taken from the ASX and no structural detail could be seen.
The image beneath is EagleEye structurally enhanced. Three strong NW trending shear zones and strong circular structures were seen. I interpreted this and put on exploration targets and send it out to the Exploration Company concerned. I heard nothing back from them, which is the usual case, but I noticed that they immediately started drilling in the areas that I had outlined with stars as exploration targets, and have reported reasonable mineralisation there.
The right-side image is Ora Banda/Kalgoorlie aeromagnetics with a very well processed image by Fathom Geophysics at the top and the EagleEye processed image underneath. The structures are much more clearly seen in the lower plan.
There have been comments that the EagleEye images are not ‘registered’ images. If a registered image is needed then five reference points can be carried through each image as it is processed and this enables the plan to be remain registered during the operation.

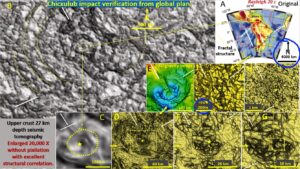
The figure above should be self explanatory. It details the broad process (but not the intricate detail) followed in getting the ultra-detailed image (J) of the very brecciated core uplift of Chicxulub impact from image A. Image A is a continental scale seismic tomographic plan at 27 km depth that extends from the Pacific Ocean through South America to Africa, a distance of 11,000 kms.
This starting image A is really just a fuzzy, colour contour plan of South America (Vdovin et. al., 1999) and is very smoothed digital data. Currently, not very much more detail can be got from these sort of plans that the average geoscientist can use for more detailed geological mapping or exploration targeting. This is unsatisfactory considering the state of the medical (MRI, ultrasound etc) and other industries fantastic treatment of similar data!
On the first enhancement of the structure (image B) I noticed in the top left-hand corner of the image remnants of a 2000 km diameter concentric ring structure. I recognised it was about in the position of Chicxulub Impact – the one that caused the extinction of the dinosaurs 66 million years ago.
Having a closer look at the centre it can be seen that the centre is a bowl shape structure about 150 km across (image C). Image D shows my central structure and how it compares with image E, which is the 3-D gravity of Chicxulub (Klokoˇcn ́ık, J., 2010). They are identical in the number of rings and even down to the 10 o’clock linear structure in the NW.
If you then follow the EagleEye images from F to J you will see that the Chicxulub impact is consistently geologically rendered (see previous posts for the geophysical detail) and is hugely magnified to 200 metres at the centre of the impact. Most importantly, all through the process of each enlargement the level of detail increases. This process can continue down to the a much smaller scale as I have proved in other posts on the Yilgarn, Stawell, Carlin, Abitibi, Kalgoorlie, Norseman, Julimar, and many other mineralised areas for clients. This process is called dithering and is used extensively in the new video animation and AI industries.
Apart from the gross Chixculub Impact geology/geomorphology, one can follow the individual NNW and WNW structures (yellow or white depending on background) right through from image B to J. Thus the structures are fractal.
This suggests strongly that the EagleEye system is locating and rendering those structures accurately. If you care to try it yourselves there are many other geophysical structures that can be followed right from the 3,000 km to 200 metres scale. Don’t just take my word for it 🙂
Conclusion. The EagleEye system can get a effective structural detail from these type of plans and that detail is immediately usable by geoscientists.
BEWARE! This use of structural recognition software and the structures it produces, can change your paradigms of Earth’s Evolution and mineralisation history!!
Cheers and happy dithering!
Bob

