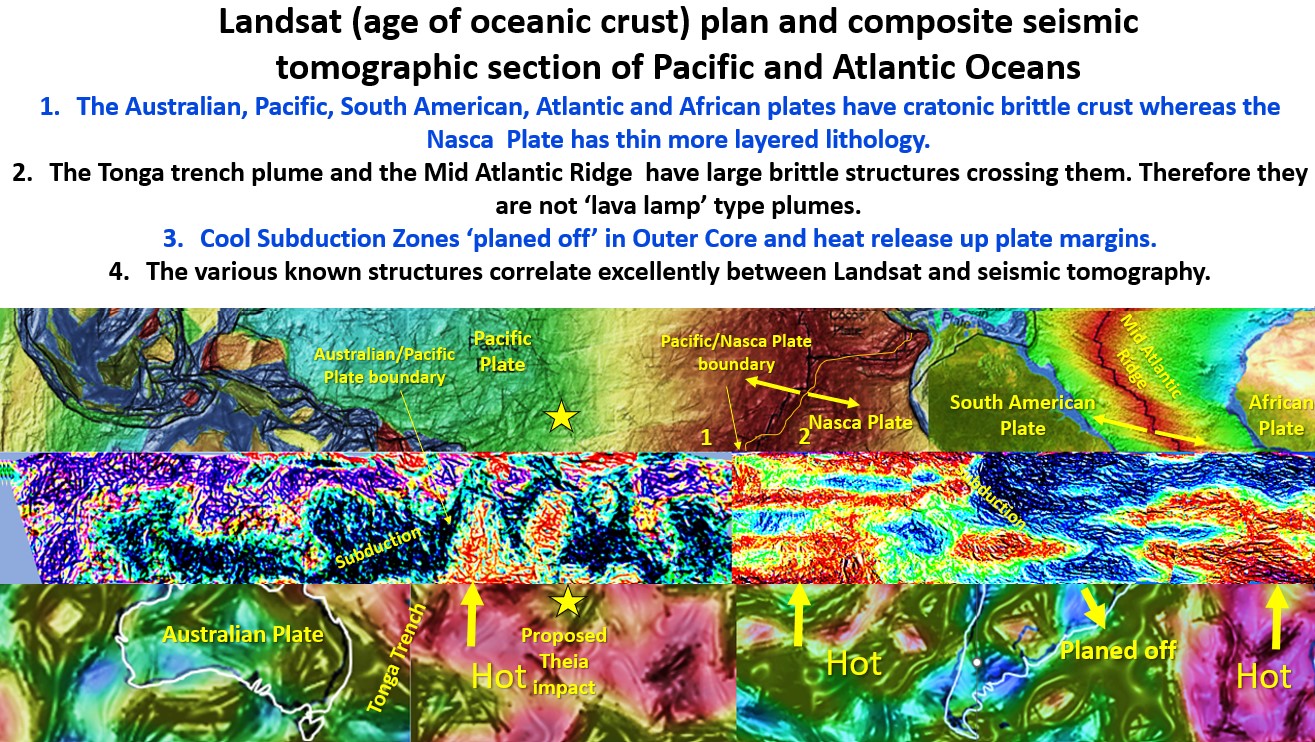
In figure 40 (in part 11) we examined section M-N across Africa and noted that the lithosphere under Africa down to the Outer Core is brittle. Is this a one-off occurrence?
To find out we are now going to look at seismic tomographic sections right around the southern hemisphere, across the Indian Ocean past Australia, across the Pacific Ocean, across South America to Africa and then across Africa.
I have never seen this global research done down to the core using seismic tomography with structural geology.
First, we will look at Landsat of the Pacific Ocean which covers most of section 1 above.
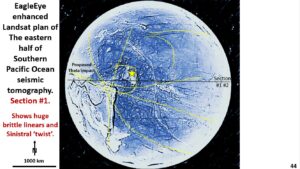
This is an EagleEye enhancement of the central Pacific around where Theia impact may have occurred at 4.57 Ga. There are huge linear structures the across the Pacific Ocean at 020° direction (which includes the Tonga Trench) and 110° direction.
Earth’s axis is tilted at 23° it is interesting to note that these 110° structures extend the major tectonic zone from the western Pacific through to Europe seen on the 60 km depth seismic tomography plan in figure 26.
Structures on the 020° direction are the Mid-Atlantic Ridge and the Tonga Trench and many other global structures.
Tonga Trench is the boundary of the Australian and Pacific plates. There is an old rule that the depth of a fault is equal to half its length and if this is true then these up to 10,000 km long linear structures should extend to the core, but only if the lithosphere is brittle. Do they?
It is interesting that above where the Theia impact (yellow star) is estimated to have occurred that there is a big change in texture in the floor of the Pacific Ocean and quite a few circular structures.
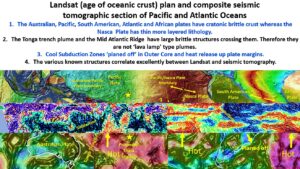
This figure is extremely instructive! The plate boundaries (Australian – Tonga Trench and Pacific/Nasca) in the Landsat top plan correlate well with those in the central seismic tomographic section.
Also, the same plate boundaries at the base of the section correlate with those on the 2775 km depth seismic tomographic plan at the base of the figure. In particular, the Tonga Trench is even at the same azimuth (020°) at the base as at the surface.
These plate boundaries are subvertical and extend right to the Outer Core.
In addition, strong NS linear structures extending south from Sumatra on the left-side of the surface Landsat plan are observed cutting right through the seismic section and are strong (and in the same direction) in the 2775 seismic tomographic plan at the bottom.
The ‘hot’ zones in the 2775 km depth plan correlate with those in the central section. These hot areas are the origin of the upwelling Pacific Ocean material that drives the tectonics outwards forming the subduction zones.
The numerous structures correlating over three data enhancements is strong validation of the detailed structural geology produced by the EagleEye system.
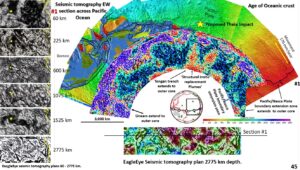
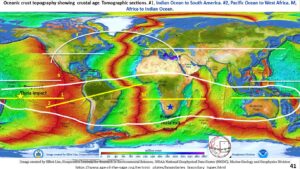
This plan uses the same data as figure 43 but is presented as it appears, insitu, around the globe .
The series of seismic tomographic plans on the left side are from 60 – 2775 km depth and show the details of the structural geology. The main WNW, NNE, NW, and NE structural directions extend from the surface to the Outer Core. They are consistent, not random structures on each surface!
In the lowest, 2775 km, plan a large circular structure is observed surrounding the suggested Theia impact site (black star). This corroborates this hypothesis.
Section #1 starts under Sumatra in the Indian Ocean, crosses through Northern Australia to the Tonga Trench in the middle of the Pacific, which is the Australian/Pacific plate boundary, then crosses the Pacific Ocean ending up in the Nasca plate off South America.
What I really want to point out is the Tonga Trench/Australian plate Pacific plate boundary located below the yellow Theia impact star in the centre of the image. It is a very strong structure extending on a steep east dip, right from the surface to the Outer Core.
The earthquake epicentres in the earlier figure 15 shows earthquakes going to the Outer Core down the Tonga Trench structure. This is indirect evidence that this strong vertical plate boundary is real and that the adjacent brittle plates are impacting each other causing earthquakes because of their differential movement.
Just to the east (right) of this plate boundary are two hotter areas of the lithosphere which are currently classified as plumes. In fact, they are the ‘signature plumes’ of the ‘conveyor belt mobile mantle’ hypothesis! Are they real?
There are many sub-vertical and flat structures cutting across these ‘plumes’ suggesting that they are comprised of brittle lithology and not viscous lava lamp type plumes which would not preserve sharp geological boundaries. Thus both the South African and Tonga plumes appear to be composed of brittle lithosphere.
This evidence and all of the other brittle structures in the area of the supposed mobile mantle suggests a major rethink is needed on the ‘mobile mantle/plate tectonics’ hypothesis!
We will look at the seismic tomographic section #2 from Tonga Trench through to West Africa in the next section #13.
Cheers
Bob

