3. Landsat

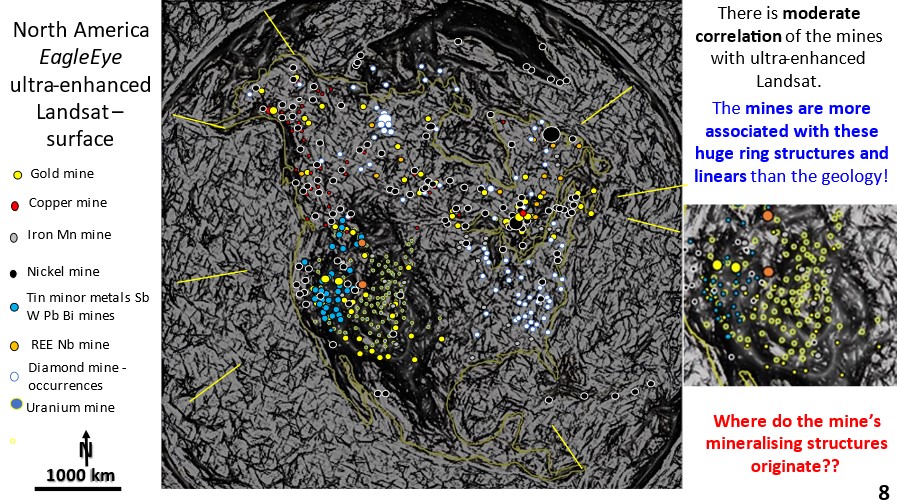
This figure shows Landsat of North America (Google Earth 2021) with overlaid mines. It can be seen that there are very few mines down the centre of North America. This is because of lack of outcrop in the out-wash area of the Rocky Mountains and the vast riverine alluvial plains.
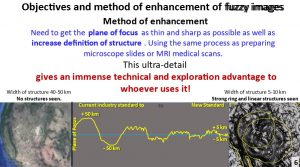
This figure shows the principle of the EagleEye enhancement method of fuzzy images. If you want to get ultra-enhancement then you need to get the plane of focus down as fine as possible. This is the same approach that you use on a microscope slide.
The industry standard detail for continental-scale Landsat or other data, such as gravity, seismic tomography and magnetics is to about 50 km focus. I can get down to 5 to 10 km focus. The image on the left is original Landsat and the detailed image on the right was obtained by my EagleEye enhancement method.
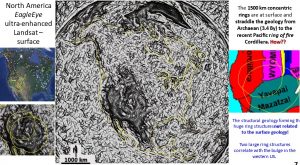
This is an ultra-enhanced Landsat image with many geological structures showing. The most obvious are two or more overlapping > 1,000 km diameter ring structures located in Western North America. We will be tracking these ring structures from the surface right down to the Core Mantle Boundary at 2,850 km depth.
The two ring structures have no correlation with the surface geology seen in the right-side image. One would expect the surface geology to reflect these gigantic ring structures?
How can these structures not affect the surface geology? These surface rings are palimpsests, formed by upward migration of magma and mineralising fluids originating from the underlying buried rings and structures (McCafferty, 1995. DOI: 10.1080/08120091003677579).
If I was looking for the original impact structures, I would go to the centre of these ring structures to find prima facies evidence of them (French, 1998. French & Koeberl, 2010). This may not occur in the surface rocks, but in pipes and magma coming from deep beneath the surface. This occurs at the Watchorn Giant Ring Structure in the Yilgarn Craton, Western Australia Watchorn 2013. https://www.youtube.com/watch?v=l0HdKnHomeA, Watchorn 2019. https://www.geotreks.com.au/work/giant-ring-structures/watchorn-giant-ring-structure-impact-origin/).
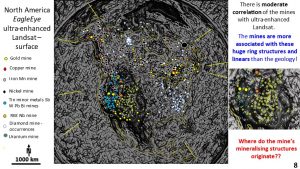
The mines are plotted onto the Landsat image. The gold and silver lead zinc mines correlate with the lighter parts of the rings and the uranium and nickel mines with the darker parts of the rings. Why is this so??
Is there a fundamental difference in their genesis and structural fluid channel pathways?
So, if the mines don’t correlate with the original Landsat image, or the surface geology, but correlate with the rings in the structural geology enhanced Landsat, what pathways are the mineralising fluids following?
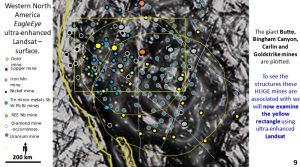
This is an enlargement of the ring structures seen in Figure 8. It can be seen that the mines follow the rings and the linear structures. In the next section we will look inside the yellow rectangle at the Butte, Bingham Canyon and Carlin mining areas.
These are some of the biggest mines in the world and should have very definite mineralisation pathways under them that we will try and trace as deep as we can.
We are now starting to get down to the nitty-gritty of exploration targeting geology. If you want to learn more on how to get this detailed geology and structural geology based exploration targeting knowledge, keep posted!!
Share with your colleagues!
Happy exploring 🙂
Bob Watchorn.

