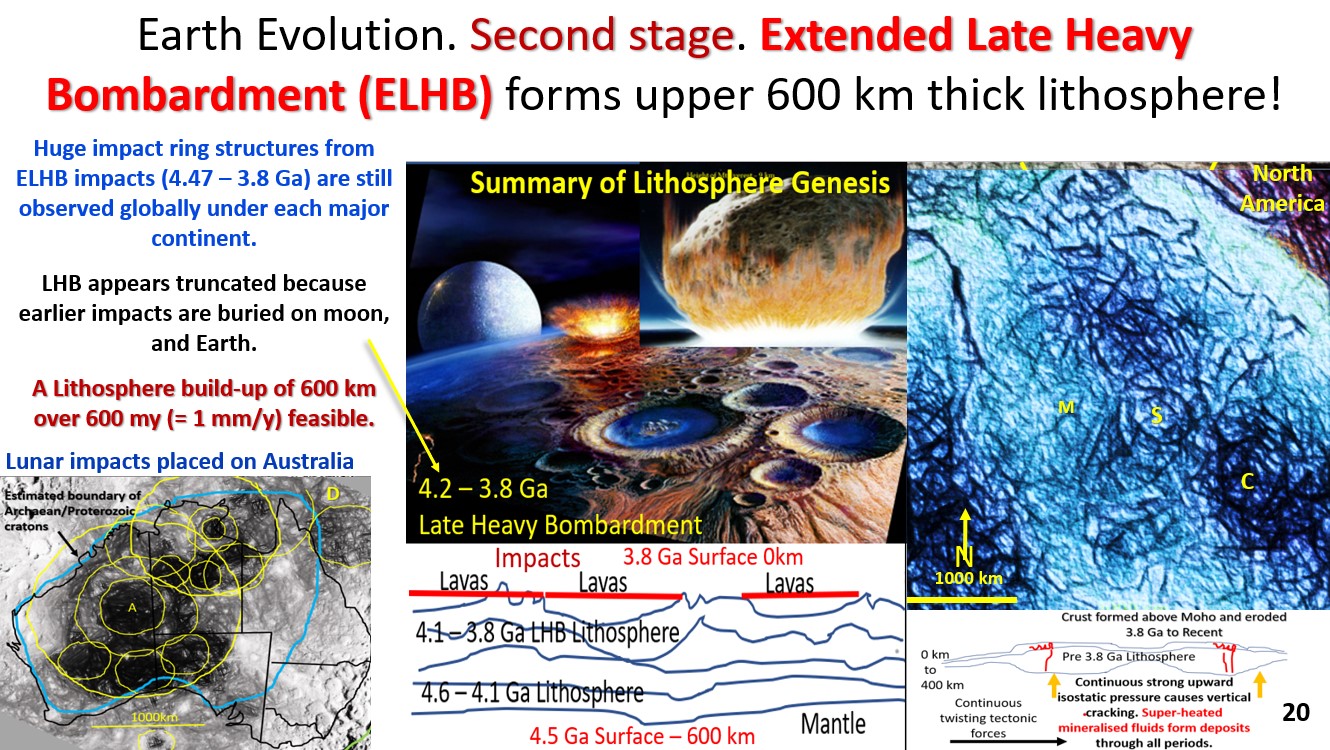
Figure 20 above. Earth Evolution second stage, Extended Late Heavy Bombardment ELHB.
My contention is that the Late Heavy Bombardment should be called the Extended Late Heavy Bombardment because there is no reason to think that the Heavy Bombardment only started at 4.2 Ga and not back at 4.47 Ga.
The AusIMM webinar I did on this new research can be seen on the AusIMM website or on https://www.youtube.com/watch?v=snu8En442Js
All the Rocky Inner planets have suffered the same gigantic bombardment very early on (figure 19). This early bombardment is not easily seen unless you can get geological structure out of geophysical data as exhibited in the previous section 7.
The evidence that I have seen through all my plan and section research is that the top 600 km contains most of the huge ring structures (see lower-centre inset). This may appear deep but when you think that the Extended Late Heavy Bombardment occurred over 600 million years it only equates to 1 mm per year raising of the Earth’s surface. How do you raise the Earth’s surface? We will come to that later in the webinar.
Do we see evidence of impact activity??
At the surface there is no evidence of the ELHB impacts because they are buried. However, we do see sparse comparable impacts that have occurred in the last 600 MY.
The top-right inset in figure 20 is the North American Continent gravity (potato earth) image enhanced by EagleEye. Gravity structures are near surface so these are not the ELHB impacts. However, even these impacts are sizeable. The aspect to note is the order of magnitude size difference of the outer ring structure compared to the recognised central impact size.
The two eastern ring structures observed are well known smaller impact structures on the surface. C is Chesapeake Impact (80 km diameter and 30 My old) and S is Slate Island Impact in Lake Superior (30 km diameter and 450 My old). The western ring structure M is located near the Beaverhead impact structure (60km diameter and 600 My old).
They are smaller than the deeper ring structures suggesting that the projectile size has been decreasing through time. It is interesting that the C and S impact outer ring dimensions are 500-1000 km in diameter that the centres are only 30 – 80km diameter. However, M has a 60 km diameter but the surrounding rings are up to 3000 km diameter. The surface expression of Beaverhead impact is not at the original impact site which is subsurface and located 100 km away due to a thrust. So, it is easy to see how one could miss these big impact structures on the surface. The North America webinar explains this concept in detail –
Comparison of these later impacts with the Lunar impacts of the LHB.
The lower left inset shows lunar impacts compared to the size of Australia. These are roughly the same size as the top right-hand inset impacts in North America. This is evidence that only the later impacts are seen at the surface and all the early larger ones are buried.
The first paradigm change is the recognition of huge buried rings and linear structures on all of the Rocky planets (section 7 figure 19).
If after this webinar and my many other webinars you do not recognise huge buried rings and linear structures then could it be construed that you have got your head in the sand??
That being said, there does not appear to be any published record of impacts of greater than 300 km on earth. Why? My premise for the inability of the geophysicists and earth scientists to be able to recognise the structures is their current inadequate software. I do not believe that they use pattern recognition software as do the medical and archaeological professions, and myself? Why?
We will use the EagleEye system on seismic tomography to see what these ELHB structures look like.
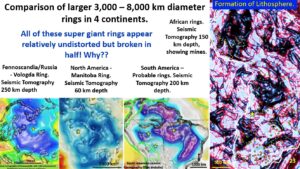
This figure shows a comparison of 3,000 to 8,000 km diameter giant rings on four continents.
See the original links. There is an abundance of groundbreaking papers on this topic on my website geotreks.com.au
Join the 50 or so other geoscientists per day who go to ARCHIVES on this site to find the geological and exploration articles they seek.
Two Fennoscandian papers.
North America lots of good papers on the structural geology and mineralisation of NA.
https://www.geotreks.com.au/uncategorised/ausimm-north-america-webinar-part-4-seismic-tomography-at-60-km-depth-showing-the-relationship-of-the-mines-to-structural-geology/ North America webinar. https://www.ausimm.com/videos/community-event/south-west-wageoscience-society—digital-tech-talk-new-discoveries-in-the-structural-geology-mineralization–exploration-targeting-of-north-america/
South America Papers and webinar.
Webinar. https://www.ausimm.com/videos/community-event/south-west-wa-branchgeoscience-society—digital-tech-talk—south-american-structural-geology/ Papers; https://www.geotreks.com.au/work/giant-ring-structures/structural-geology-south-america-from-40-to-200km-depth/
Use these for exploration targeting!
Africa.
All these supergiant rings appear relatively undisturbed but broken in half! Why?
A clue might be that the continent margins follow these huge ring structures.
Maybe when the early rifts and outer surface cracking of Earth occurred they broke through the huge rings and formed the core of the remaining continents. If the core is like smaller impacts then it will be very thick, solid, basalt lavas.
Evidence of increasing size of rings with depth.
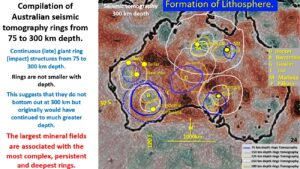
This figure shows a compilation of the ring structures in Australia from 75 to 300 km depth.
See the original paper at https://www.geotreks.com.au/work/giant-ring-structures/australian-lithosphere-tomography-75-to-300-km/
and the webinar at; https://www.youtube.com/watch?v=6BbsFImSHBM
The rings get larger with depth as they do in all other places I have researched.
This suggests that they do not bottom out at 300 km but originally would have continued to much greater depth.
The largest mineral fields in Australia are associated with the boundaries of the largest rings and the intersection with other rings.
I have done talks on how to target successfully using these ring structures.
This will be the subject of my next webinar.
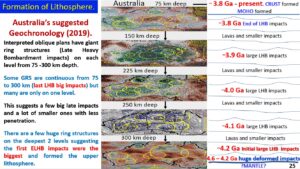
This figure shows the suggested formation of the lithosphere under Australia at 1 mm/ year (300 My at 1 mm per year equals 300 km depth). The largest ring structures are the deepest which corroborating with the other continental studies. As the subducting lithosphere gets melted at the base and extruded up the earth-wide volcanoes and ridge system they gradually bury the older surface.
See the original paper at https://www.geotreks.com.au/work/giant-ring-structures/australian-lithosphere-tomography-75-to-300-km/
The next section will be;
Earth evolution third stage. Post Late Heavy Bombardment tectonism forms earth cycles.
Cheers
Bob

