Figure 29. Pilbara Seismic tomography, 300 km depth.

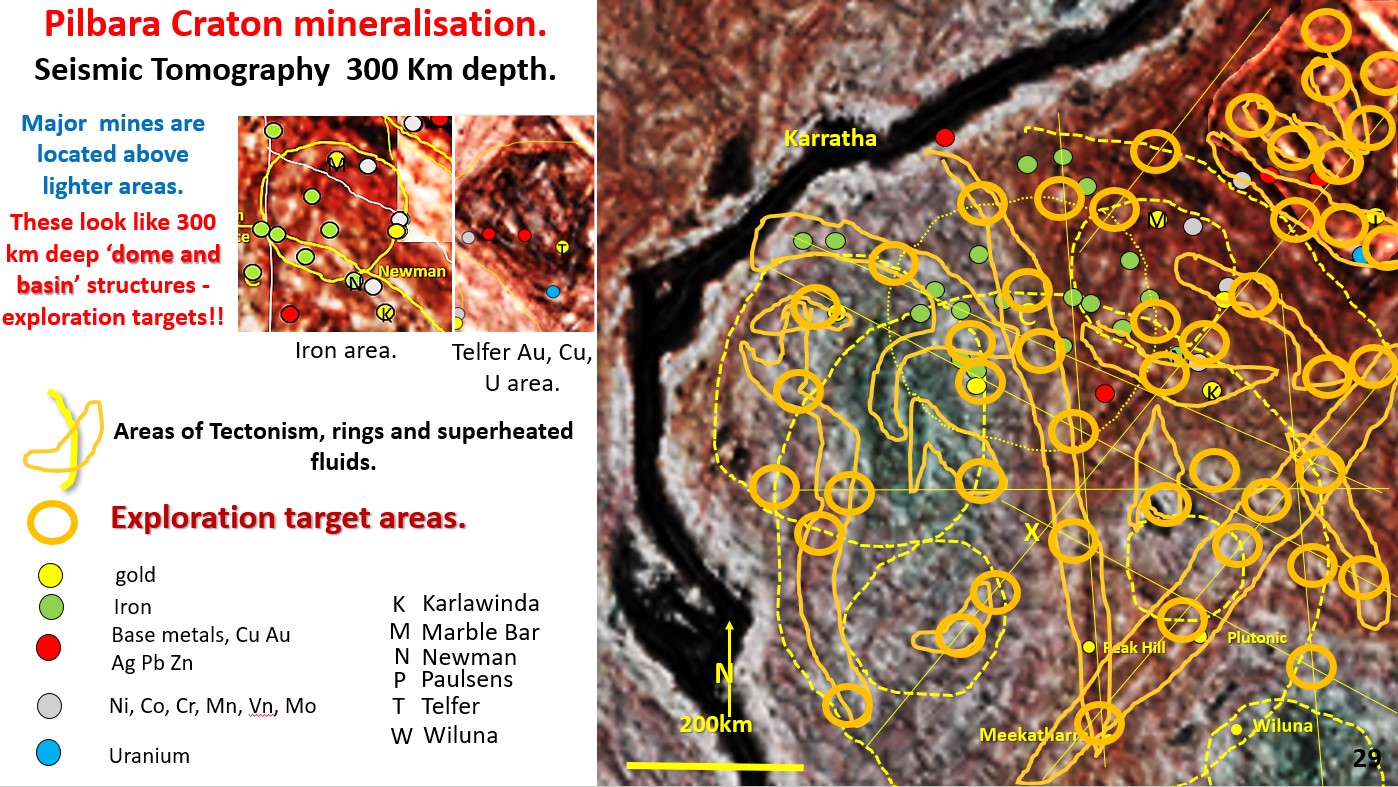
10. Pilbara Craton structural geology, mineralisation and Exploration Targeting. Western Australia. (Part 10).

Figure 29 above. Pilbara Seismic tomography, 300 km depth. Geology and mineralisation, Exploration targeting based on maximum P/T gradient. This figure has had the high P/T boundaries marked out in … [Read More]

Like it? Share it!
Figure 22. Yilgarn Seismic tomography, 300 km depth. hotspot Exploration targeting.

8. Global Exploration techniques. Targeting in the Yilgarn Craton Western Australia (Part 6).

We will now get into the exploration targeting section of the talk and will start with Australia, down on the lower-right corner of the next figure. This plan shows the … [Read More]

Like it? Share it!
Figure 13. Mineralisation paths - South America Seismic Tomographic section 5 °S

7. Global mineralising systems. Mineralisation paths through subduction zones in South and North America (Part 5).

Figure 13. Mineralisation paths – South America Seismic Tomographic section 5 °S. This figure is of the subduction zone under South America at 5° South. The current mobile mantle hypothesis … [Read More]

Like it? Share it!