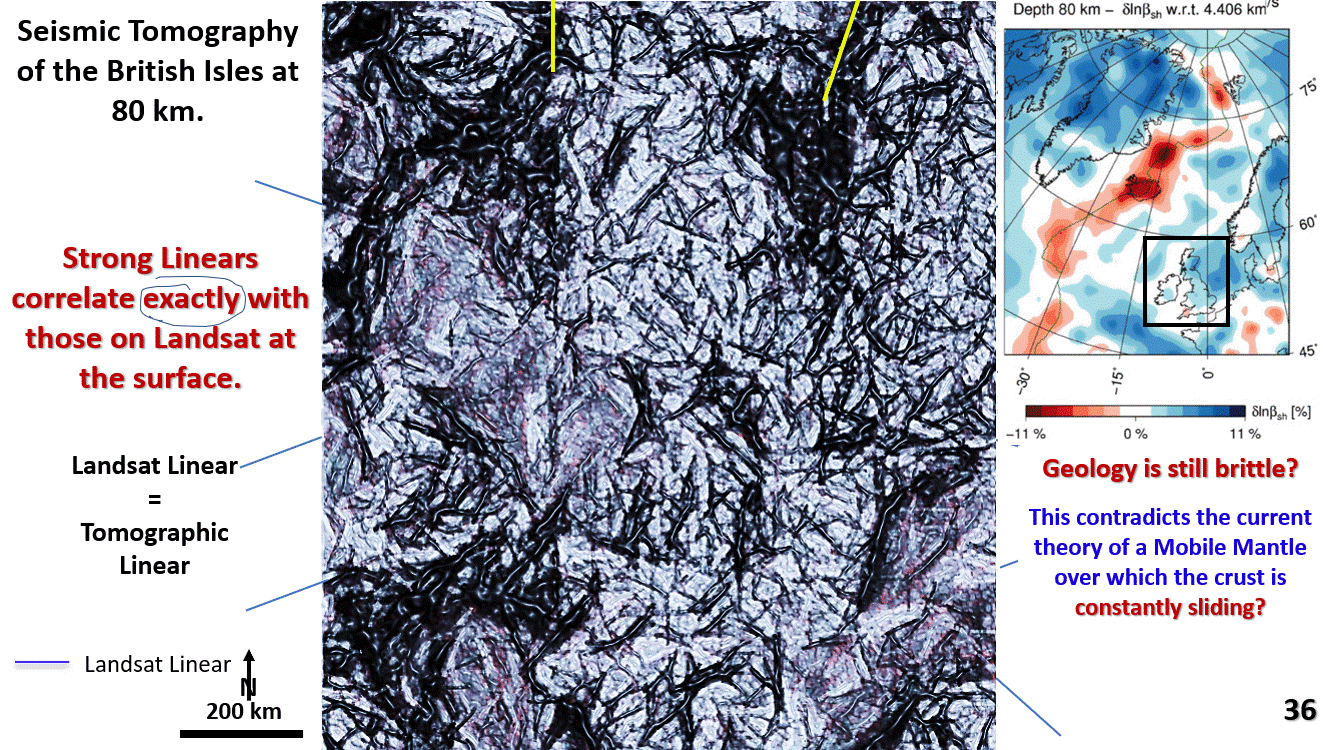
Figure 36. Seismic tomography of the British Isles at 80 km depth, EagleEye ultra-enhanced.

Seismic tomography of the British Isles at 80 km depth. Why is there good correlation of structures at 80 km depth with the surface structures, henges and mines? Part 12.

Seismic tomography of the British Isles at 80 km depth. Why is there good correlation of structures at 80 km depth with surface structures, mines and henges?

Like it? Share it!
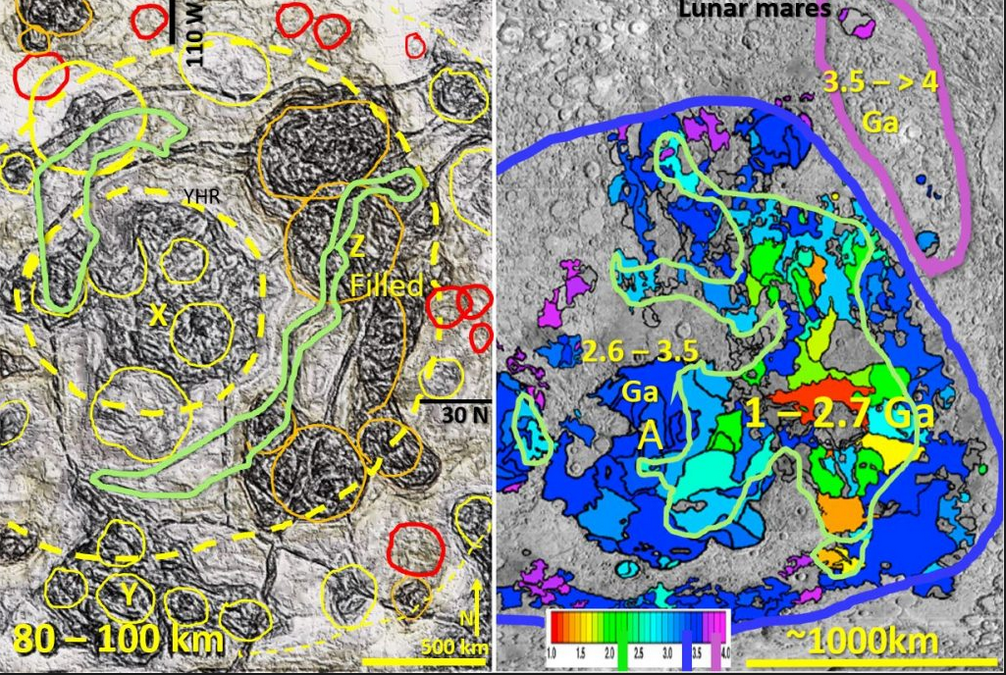
Figure 4. North China interpreted tomography at 90 km comparison with Lunar mares geochronology

Video links for all Bob Watchorn AusIMM webinars with brief description of research discoveries.

Figure 4 above is an image of North China interpreted tomography at 90 km depth and a comparison with Lunar Mares geography and geochronology (same scale). The link below gives … [Read More]

Like it? Share it!
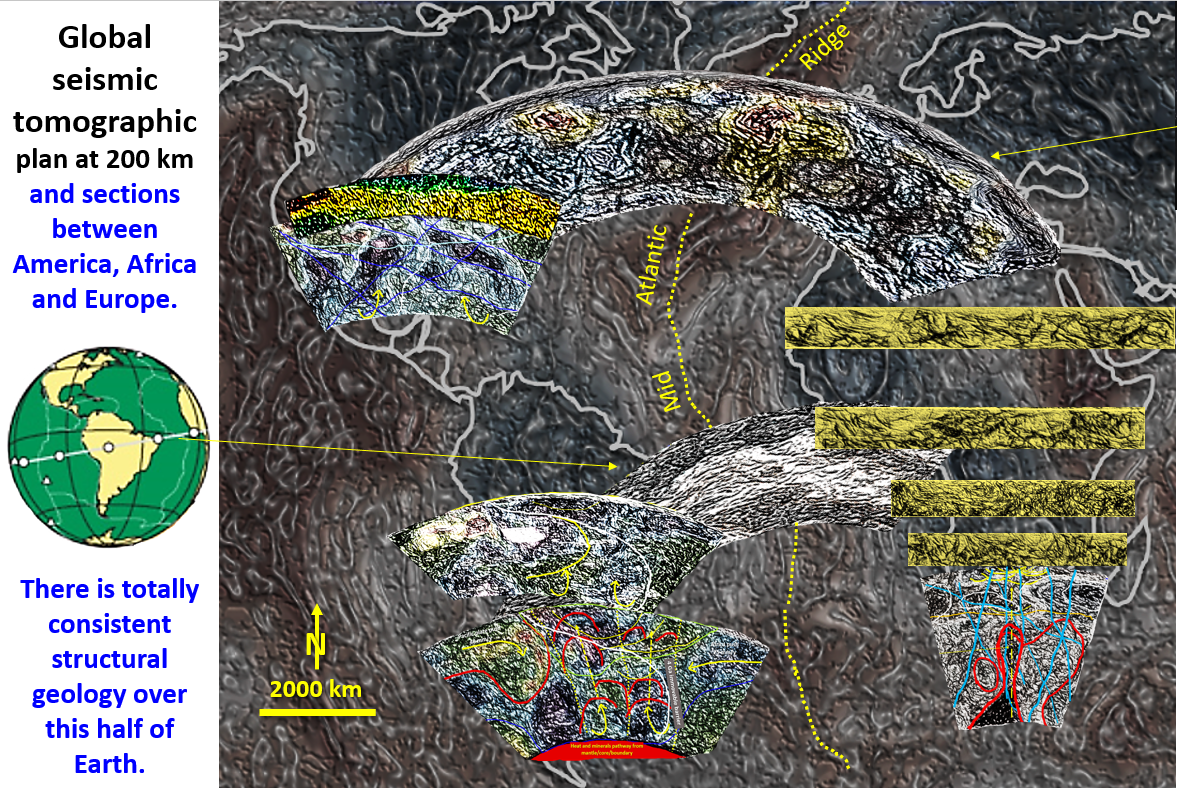
Figure 62. Seismic Tomographic sections of Africa, South and North America, Europe showing continuity of brittle lithosphere, Pacific subduction, Mid Atlantic Ridge and Europe-Africa collision geological features.

Western Hemisphere seismic tomography plan at 200 km depth and sections over Africa, South and North America and Europe, Part 16.

Figure 62. Seismic Tomographic sections of Africa, South and North America, Europe showing continuity of brittle lithosphere, Pacific subduction, Mid Atlantic Ridge and Europe/Africa collision geological features. The slide is … [Read More]

Like it? Share it!