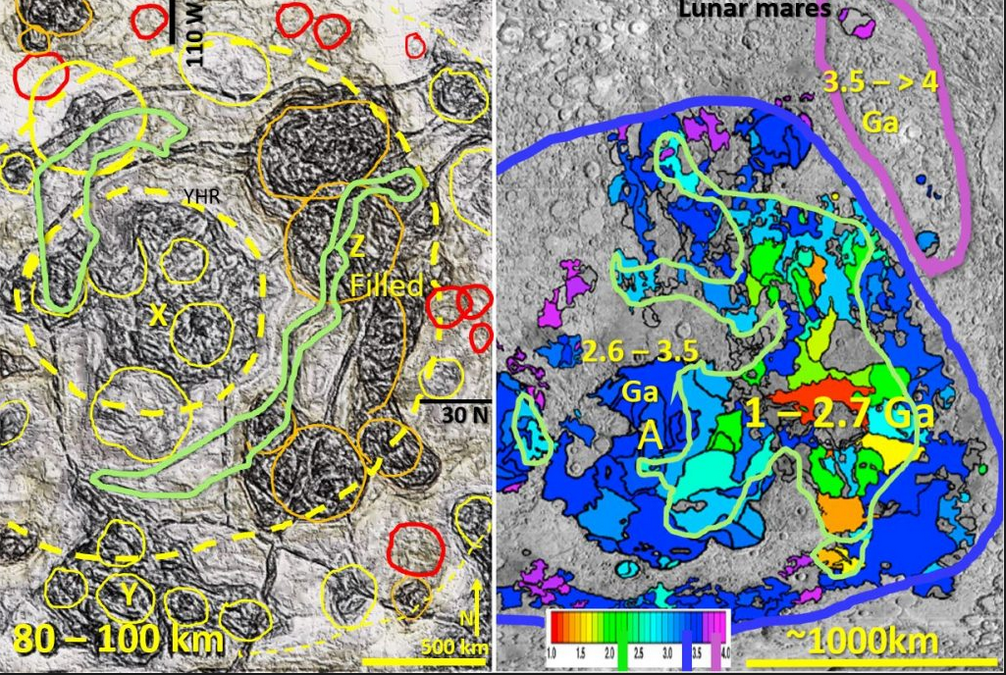
Figure 4. North China interpreted tomography at 90 km comparison with Lunar mares geochronology

Video links for all Bob Watchorn AusIMM webinars with brief description of research discoveries.

Figure 4 above is an image of North China interpreted tomography at 90 km depth and a comparison with Lunar Mares geography and geochronology (same scale). The link below gives … [Read More]

Like it? Share it!
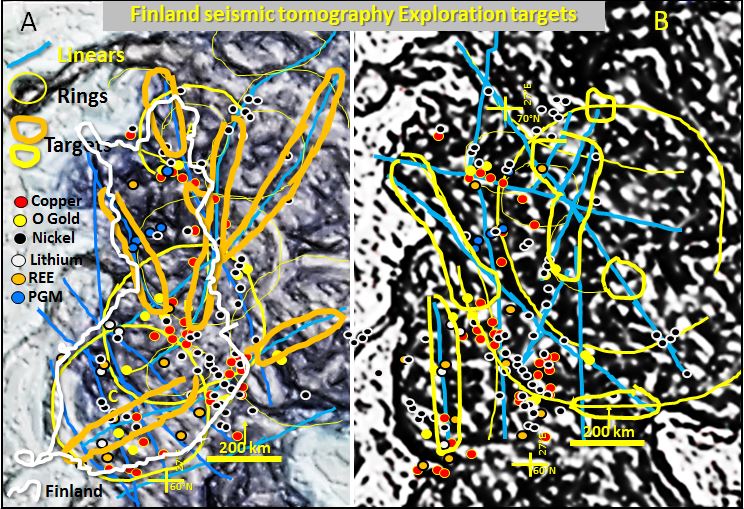
Finland mines and exploration targets

Finland seismic tomography. Geology, mineralisation and exploration potential of Finland using seismic tomography at 250 km depth.

Finland seismic tomography. This pilot study research examines the structural geology and mineralisation of Finland by comparing the surface geology and Landsat with the plan seismic tomography at 220 to … [Read More]

Like it? Share it!
Fennoscandia Russia seismic tomography structures

Fennoscandia and Russia seismic tomography showing geology of the Asthenosphere Lithosphere boundary from 100 – 270 km depth. Comparison with other continents and the moon.

Fennoscandia and Western Russia geology, using Landsat and the seismic tomography of the Asthenosphere/Lithosphere boundary from 100 – 270 km depth.

Like it? Share it!