Figure 54. Abitibi and Ring of Fire districts' seismic tomography at 100 km depth with exploration targeting..

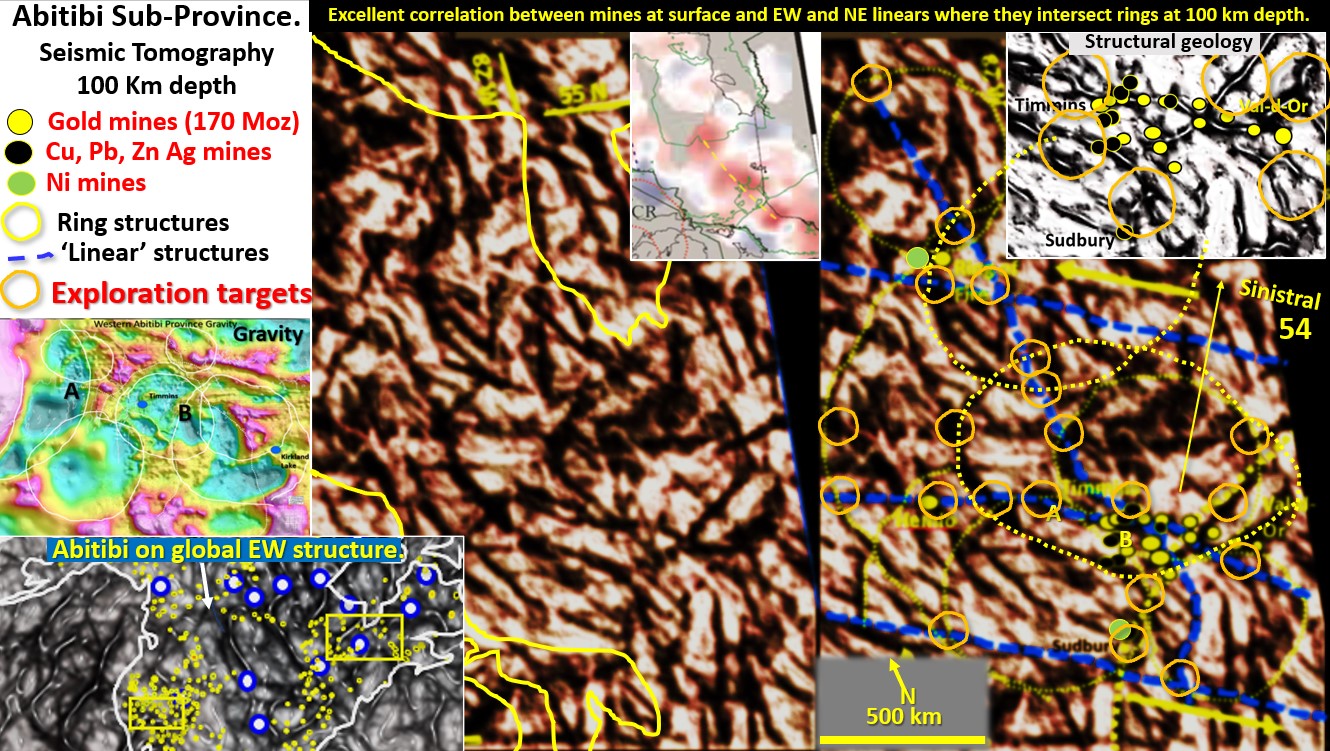
Abitibi and Ring of Fire districts’ seismic tomography at 100 km depth with exploration targeting. (Part 18).

Figure 54 above. Abitibi and Ring of Fire districts’ seismic tomography at 100 km depth with exploration targeting. The Abitibi belt is one of North America’s largest producers of gold, … [Read More]

Like it? Share it!
Figure 52a. Goldstrike, Carlin, Bingham Canyon seismic tomography 300 km depth Edge.

Carlin Bingham Canyon area North America. Mineralisation and exploration targeting seismic tomography at 300 km depth. (Part 17).

Figure 52a. Carlin Bingham Canyon area interpreted, wormed seismic tomography at 300 km depth with mines overlain. This post details my gold copper exploration targeting in the Carlin/Bingham Canyon area. … [Read More]

Like it? Share it!
Figure 53. Seismic tomography section through North America, Greenland, Europe to Arabian Peninsular.

Seismic tomography section through North America, Greenland, Europe to Arabian Peninsular (Part 14).

Figure 53. Seismic tomography section through North America, Greenland, Europe to Arabian Peninsular From the crust to the Outer Core. This figure is a section from the Pacific Ocean off … [Read More]

Like it? Share it!