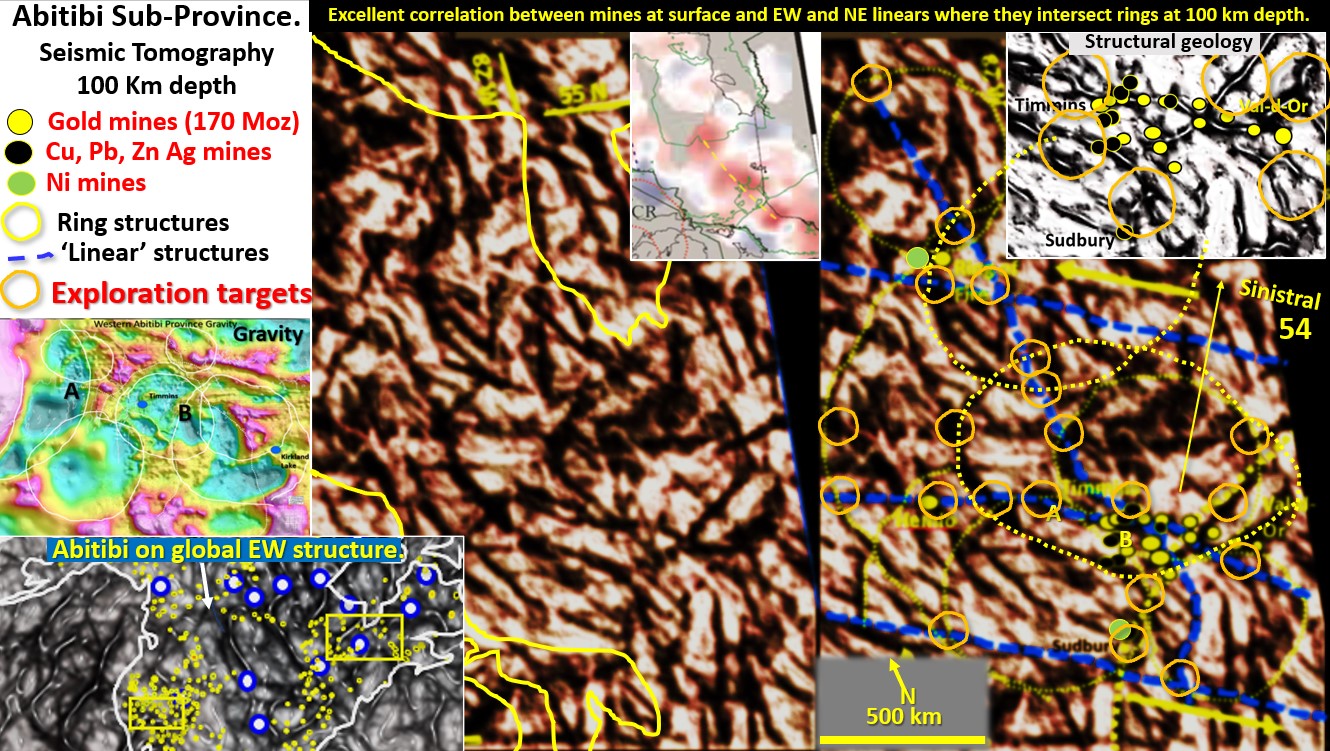
Figure 54. Abitibi and Ring of Fire districts' seismic tomography at 100 km depth with exploration targeting..

Abitibi and Ring of Fire districts’ seismic tomography at 100 km depth with exploration targeting. (Part 18).

Figure 54 above. Abitibi and Ring of Fire districts’ seismic tomography at 100 km depth with exploration targeting. The Abitibi belt is one of North America’s largest producers of gold, … [Read More]

Like it? Share it!
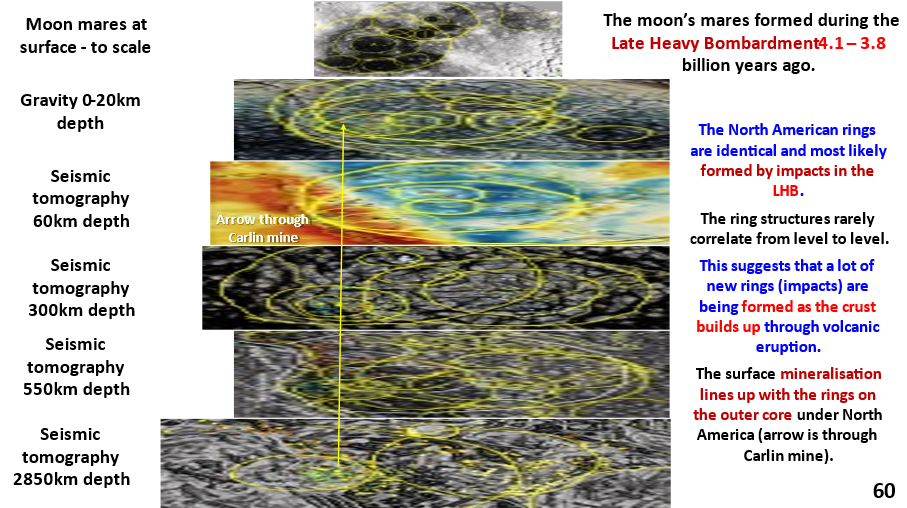
Figure 60. Stacked sections of North America from outer core to surface with inset of moon for comparison.

North America stacked sections – gravity, seismic tomography 60 to 2850 km depth and Lunar surface. Part 14. Verification of my ‘EagleEye’ structures showing examples.

Figure 60. Stacked sections of North America from outer core to surface with inset of Lunar Mares for comparison. Read the annotations on the above figure before you start the … [Read More]

Like it? Share it!
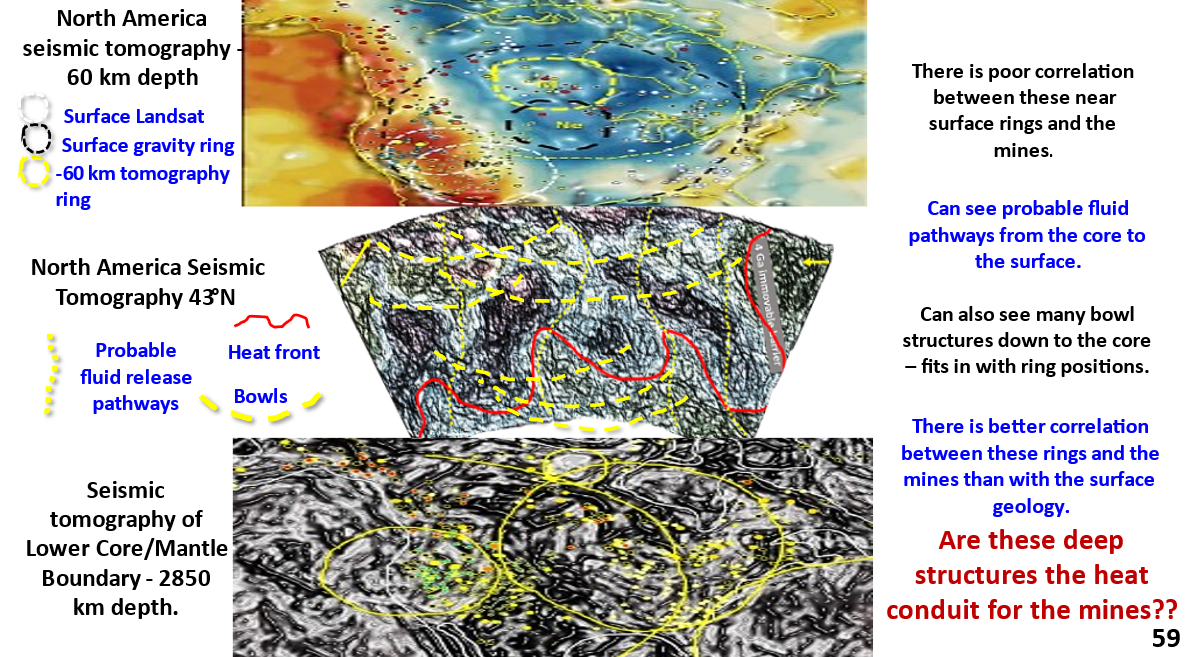
Figure 59. North America interpreted, enhanced seismic tomographic plans at 60 km depth and outer core plan at 2850 km depth with cross-section 36°N.

North America Seismic Tomography plans at 60 km and 2,850 km depths with joining seismic tomography cross-section. AusIMM webinar Part 13.

Figure 59 (above). North America interpreted, enhanced seismic tomographic plans at 60 km depth and outer core at 2850 km depth with cross-section 36°N. This figure summarises my concept of … [Read More]

Like it? Share it!