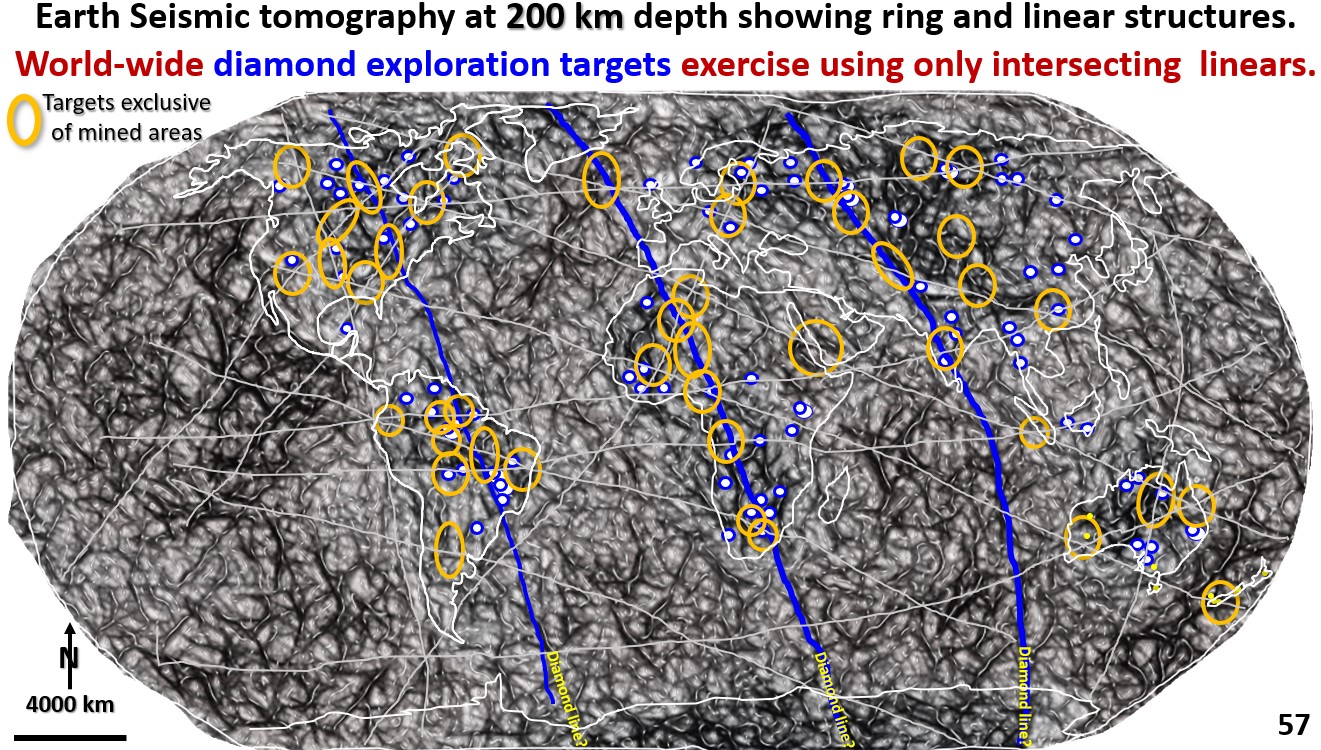
Figure 57. Global seismic tomography at 200 km depth showing Diamond exploration targets.

15. Diamond exploration targets using global seismic tomography at 200 km depth (Part 19).

Figure 57. Global seismic tomography at 200 km depth showing Diamond exploration targets. This post explains worldwide diamond distribution and suggests exploration targets based on that distribution. This figure shows … [Read More]

Like it? Share it!
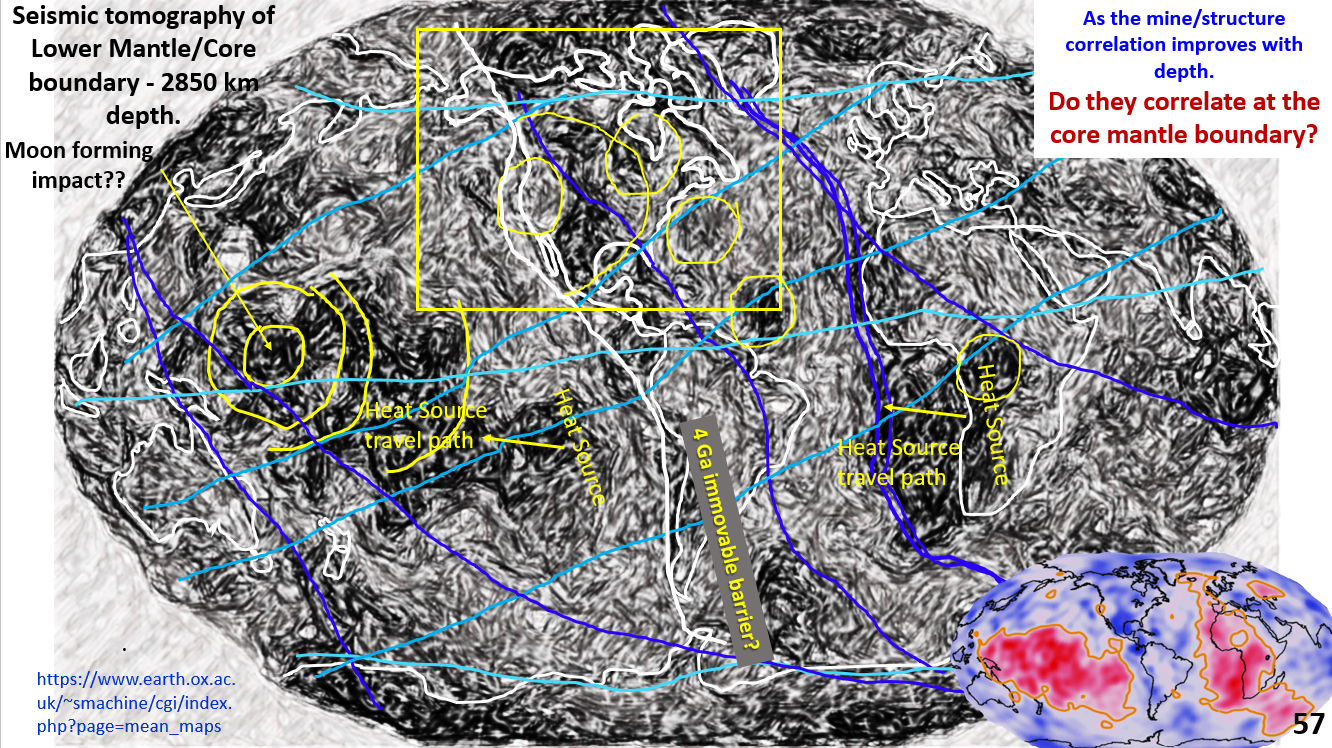
Figure 57. Outer Core/Lithosphere Boundary interpreted, enhanced seismic tomographic plan.

Earth Seismic tomography at 2,850 km depth at the outer core/mantle boundary. AusIMM Webinar Part12.

Tracing the surface structures right down to the Core Mantle Boundary (CMB) is a new area of my research (you see it first here!), . This is the first time that ultra-detailed structural geology of deep Earth has been used in constructing a model of Earth’s evolution down to the Core Mantle Boundary.
RESULT? The seismic tomography of the Core Mantle Boundary shows linear and ring structures that relate to those on the surface and on the 200 km depth tomography. How can structures 2,850 km deep propagate to the surface??
The fact that the same structural features are in the same geographic relationship to the continents above suggests that overall there has been little movement of the surface of Earth with respect to the CMB. How can this occur??
By what mechanism can the earth above the CMB be immovable when the plates at the surface move?
POSSIBLE MECHANISM. Erosion removes the pop-up mountains and the reverse spinning 5,000 C semi-liquid outer core would slice off the pop-down material like a laser cutter! This relieves the plate movement pressure and enables the continents to remain relatively static and still enable the observed plate movement.
if the mines do lie on the structures on the Core Mantle Boundary this will support this hypothesis of the hot mineralising fluids originating at the CMB.
MINERALISATION. The mechanism for deep-seated mineralisation would be super heated fluids from the core scavenging metals either from the core as they ascend and depositing them further up. It makes a lot of sense to me!

Like it? Share it!
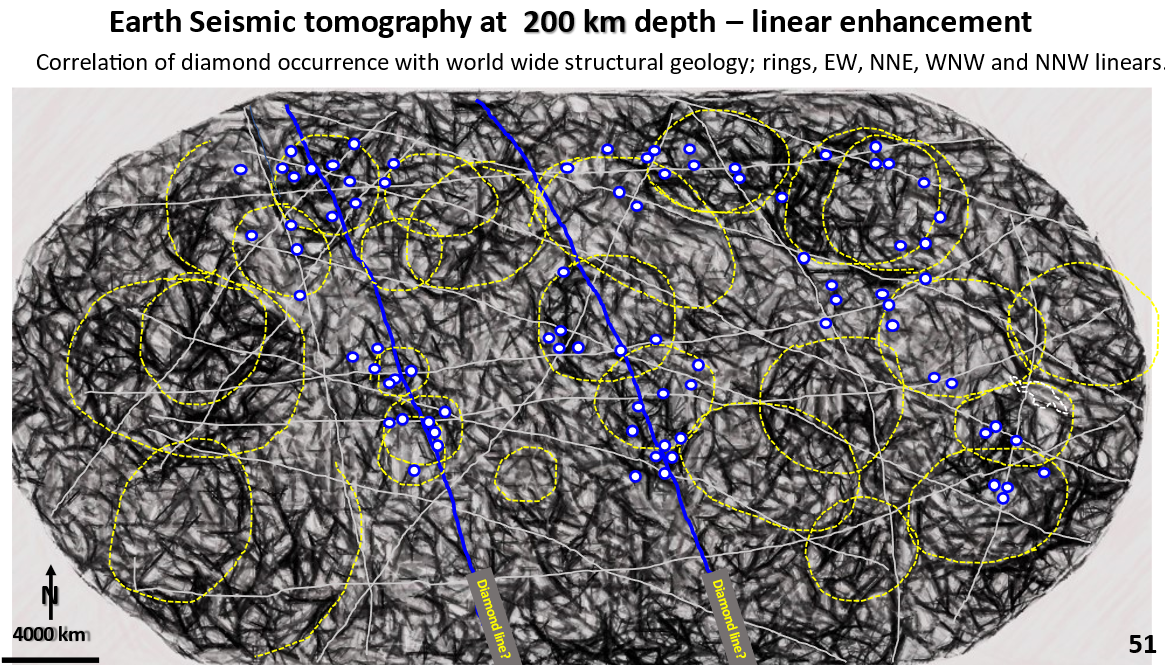
Figure 51. World interpreted, enhanced seismic tomography at 200 km depth showing diamond mines.

Discovering Earth’s geological structure and mineralisation at 200 km depth using Seismic tomography. Currently accepted Plate Tectonics paradigms need questioning! APPLICATION OF DISRUPTIVE INNOVATION. Part 9.

To navigate my geotreks.com.au website go to ARCHIVE in the top menu bar.
Introduce the concept of DISRUPTIVE innovation. The only published Earth-wide research that is currently available in tomography and various other data sources are colour contour based 3-D models, and not structural geology models. The structural geology outlined on the Earth seismic tomography at 200 km depth are Earth-scale (they go over the whole earth) .
The diamond mines follow large rings in North America, South America and Africa. They always lie in the dark areas between the rings. They also follow the large northerly trending arcs and follow EW strong linear structures.. Thus these structures form the basis for worldwide diamond exploration targeting.

Like it? Share it!