Australia
Video links for all Bob Watchorn AusIMM webinars with brief description of research discoveries.
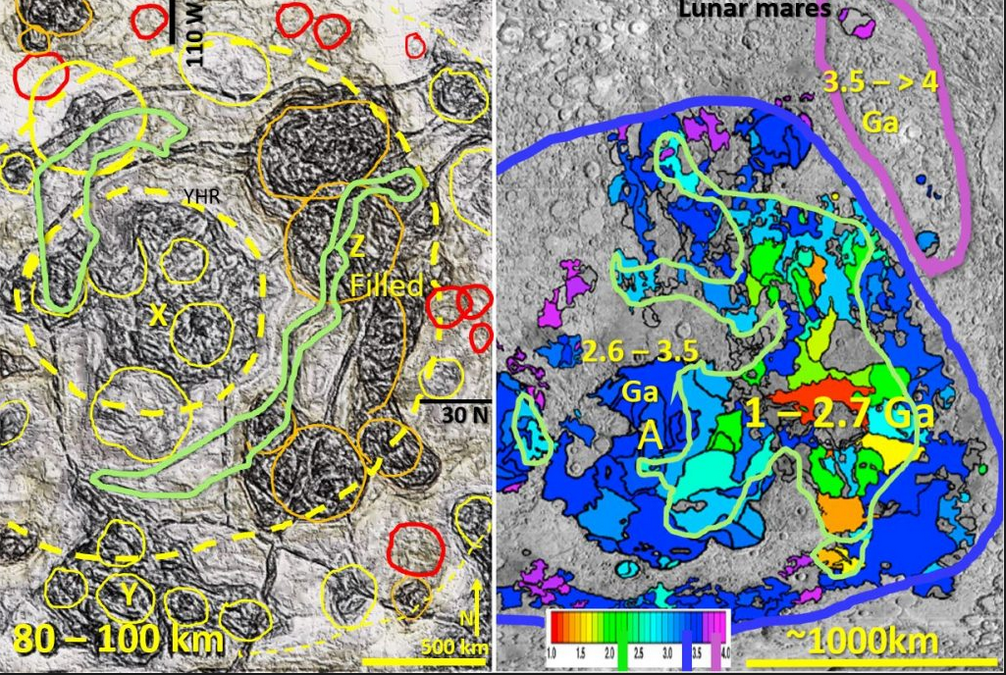
Figure 4 above is an image of North China interpreted tomography at 90 km depth and a comparison with Lunar Mares geography and geochronology (same scale). The link below gives … [Read More]


