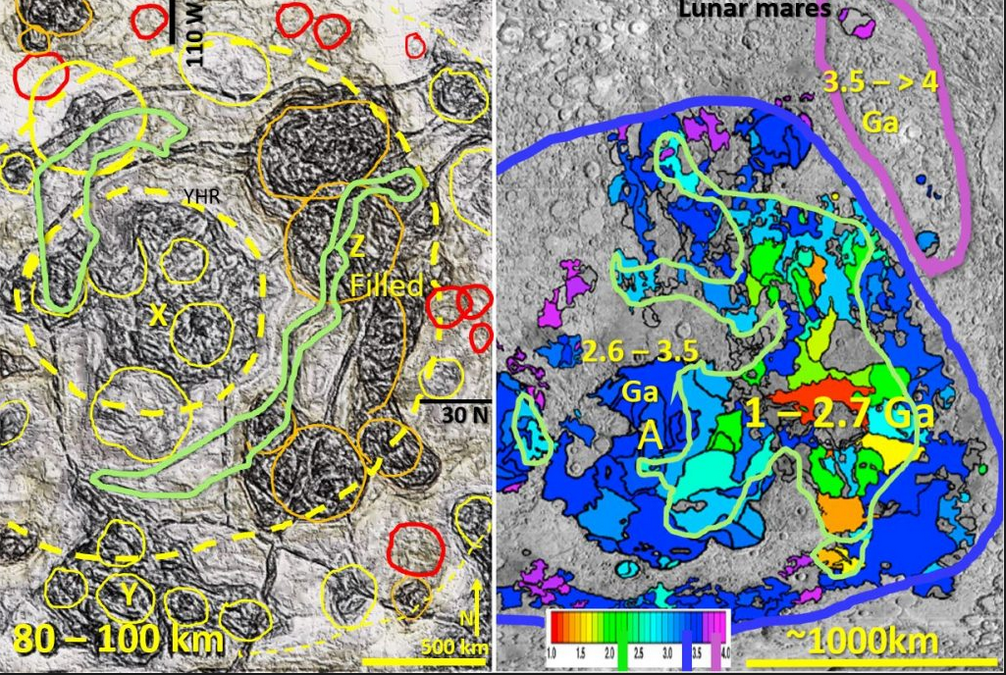
Figure 4. North China interpreted tomography at 90 km comparison with Lunar mares geochronology

Video links for all Bob Watchorn AusIMM webinars with brief description of research discoveries.

Figure 4 above is an image of North China interpreted tomography at 90 km depth and a comparison with Lunar Mares geography and geochronology (same scale). The link below gives … [Read More]

Like it? Share it!
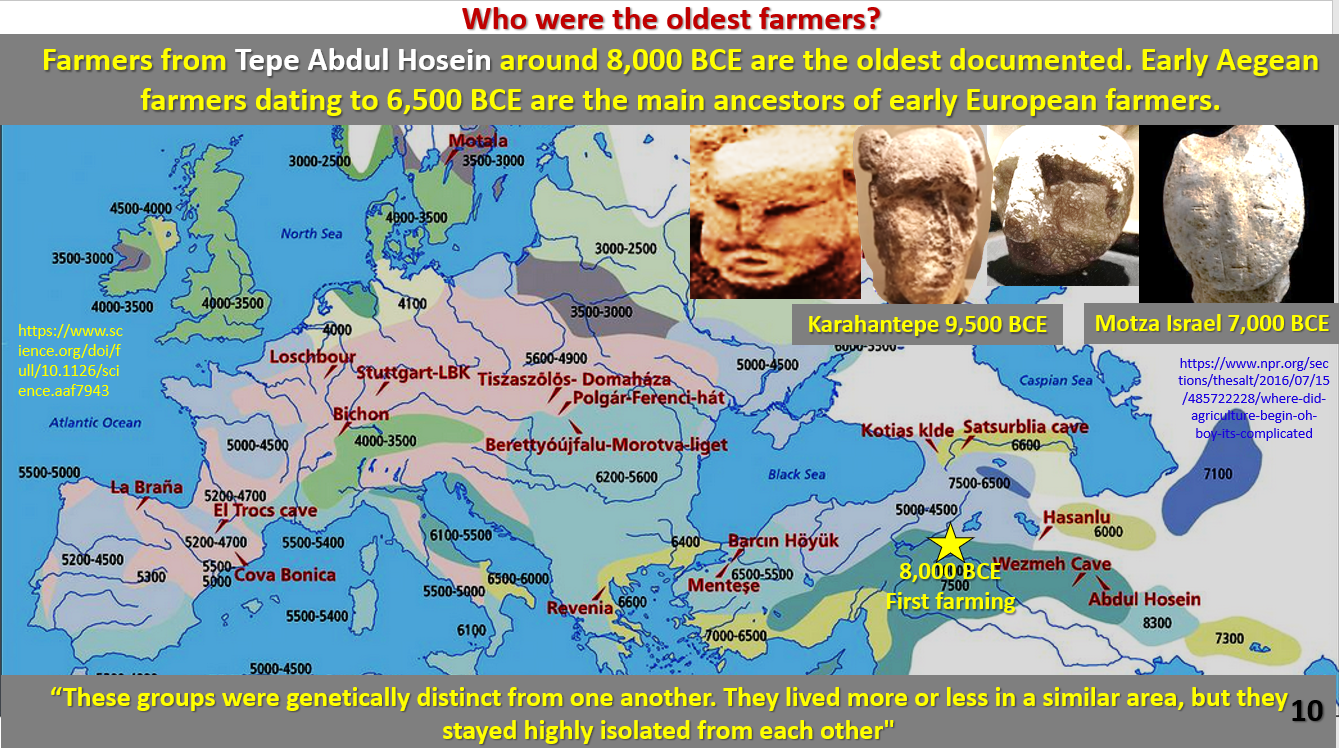
Figure 10. Who were the oldest farmers. What did they look like?

Gobeklitepe and Karahantepe in 9,500 BCE. Who were the oldest farmers/miners and what was their ethnicity and appearance? Part 4.

Figure 10. Who were the oldest farmers. What did they look like? This is part 4 of the webinar on copper mining possibly kickstarting modern civilisation. This link gives access … [Read More]

Like it? Share it!
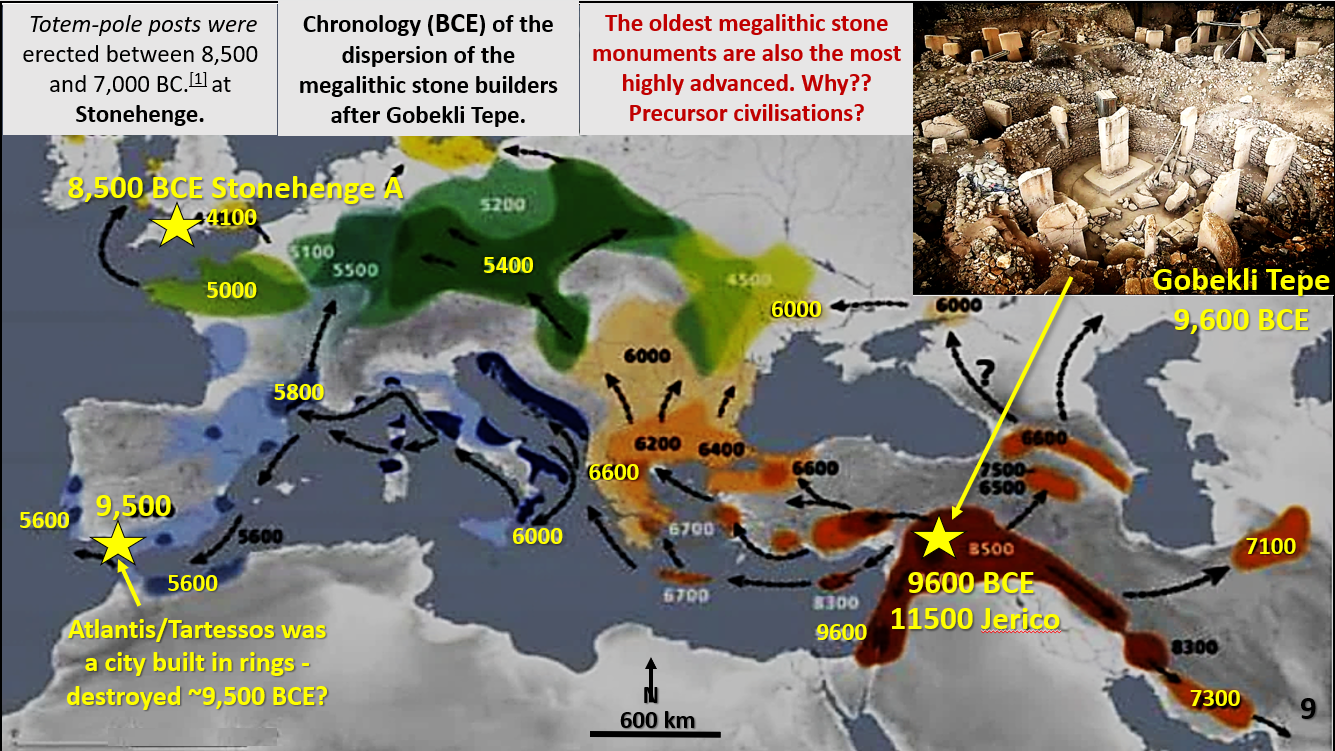
Figure 9. Chronology of the dispersion of the megalithic stone builders after Gobeklitepe

How advanced, urbanised and extensive was European/SW Asian civilisation by 10,000 BCE. Part 3.

Figure 9 above. Chronology of the dispersion of the megalithic stone builders after Gobeklitepe These papers are an expansion of my AusIMM webinar https://www.ausimm.com/videos/community-event/south-west-wa-branchgeoscience-society—digital-tech-talk-geo-archaeology-correlation-between-civilisation–mining/  I believe only the 13,000 AusIMM … [Read More]

Like it? Share it!