Figure 37. North America interpreted, EagleEye enhanced seismic tomography at 300 km depth with mining fields overlain.

North America Formation and Mineralisation, AusIMM webinar part 6. Research using EagleEye enhancement showing structural geology from the surface to 2,850 km depth.

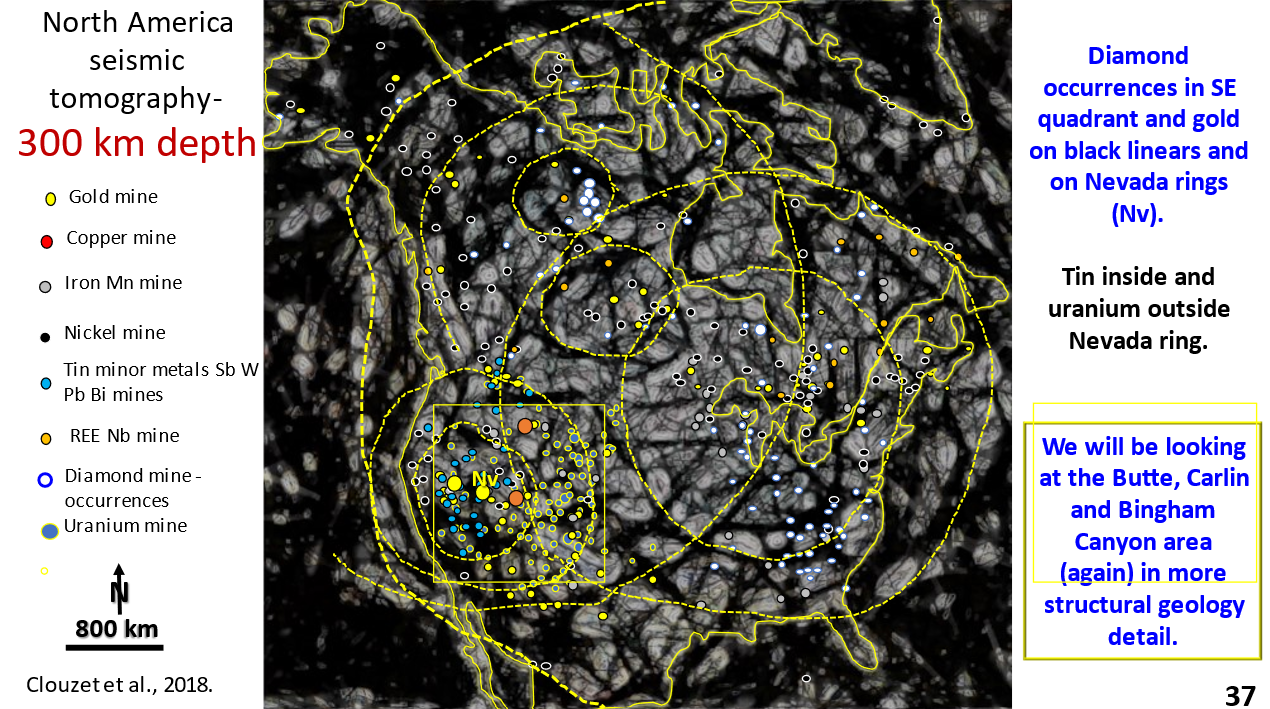
This is the EagleEye enhanced plan of the 300 km depth seismic tomography.
North American geology is still very brittle at 300 km depth. How can this be possible as we are supposed to be in the middle of the mobile upper mantle? There is a lot of detailed structural geology seen.
If by using this detailed structural geology we can crack why these huge mines are there and what structural geology they follow we will have an exploration plan for finding new fields, in this area and elsewhere in the world!

Like it? Share it!
Figure 17. Enhanced gravity image of North America depicting the density of earth as topography showing linear and ring structures.

North America. Part 3. EagleEye gravity enhancement showing giant rings, linears and their correlation with mineralisation.

North America. Gravity enhancement showing giant rings, linears and their correlation with mineralisation.

Like it? Share it!
Figure 8. North America Landsat ultra-enhanced image showing large rings and their relationship to mining fields.

North America AusIMM Webinar. Part 2. Landsat EagleEye ultra-detailed research of structural geology correlation with mineralisation.

North America. Landsat EagleEye ultra detailed research of structural geology correlation with mineralisation. The mines are plotted onto the Landsat image. Find out, in this series of posts, how to do exploration targeting from the continental scale right down to the mine scale – all from continental scale original data!

Like it? Share it!