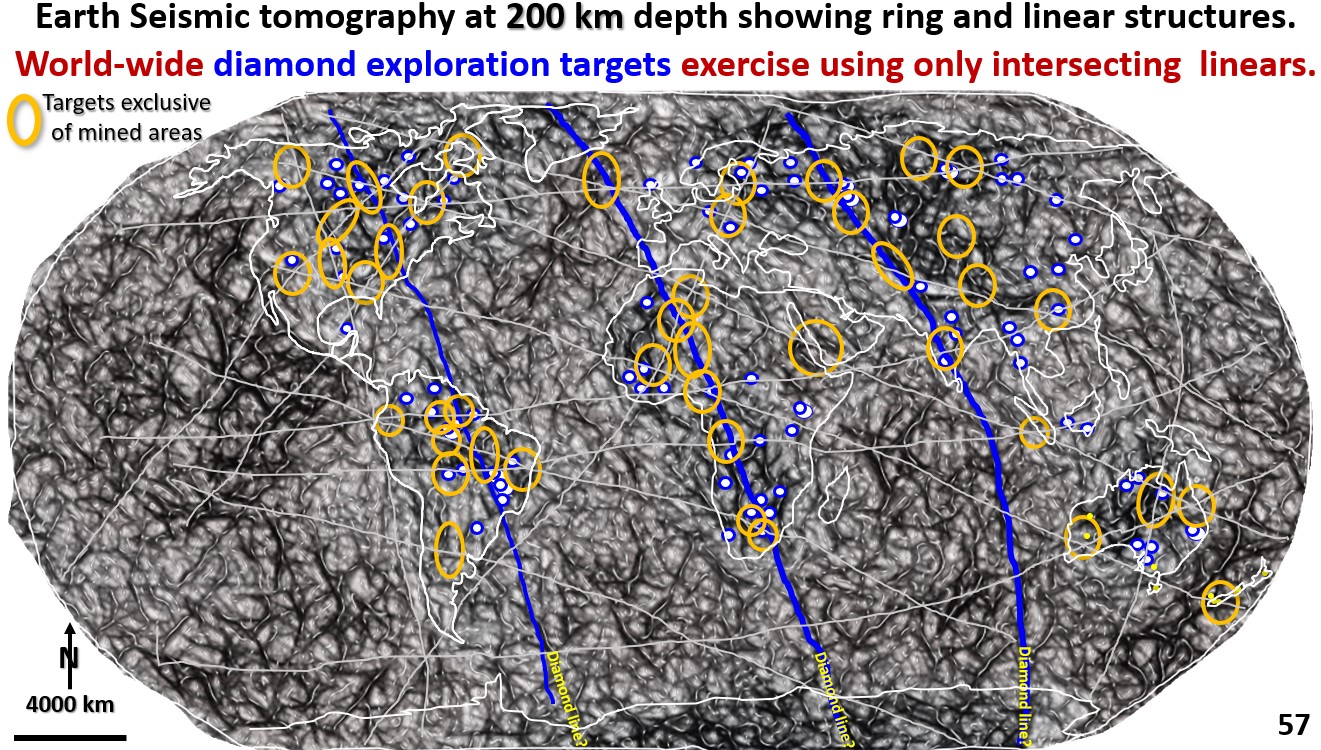
Figure 57. Global seismic tomography at 200 km depth showing Diamond exploration targets.

15. Diamond exploration targets using global seismic tomography at 200 km depth (Part 19).

Figure 57. Global seismic tomography at 200 km depth showing Diamond exploration targets. This post explains worldwide diamond distribution and suggests exploration targets based on that distribution. This figure shows … [Read More]

Like it? Share it!
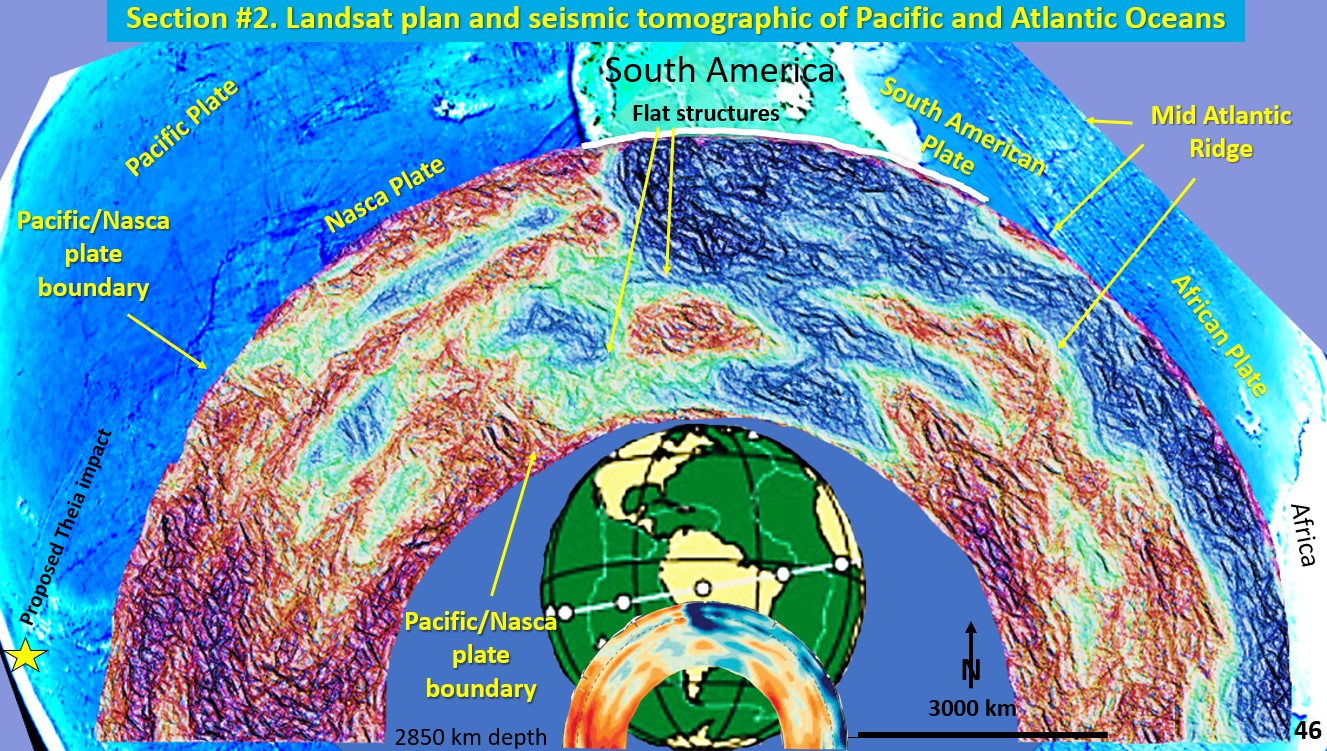
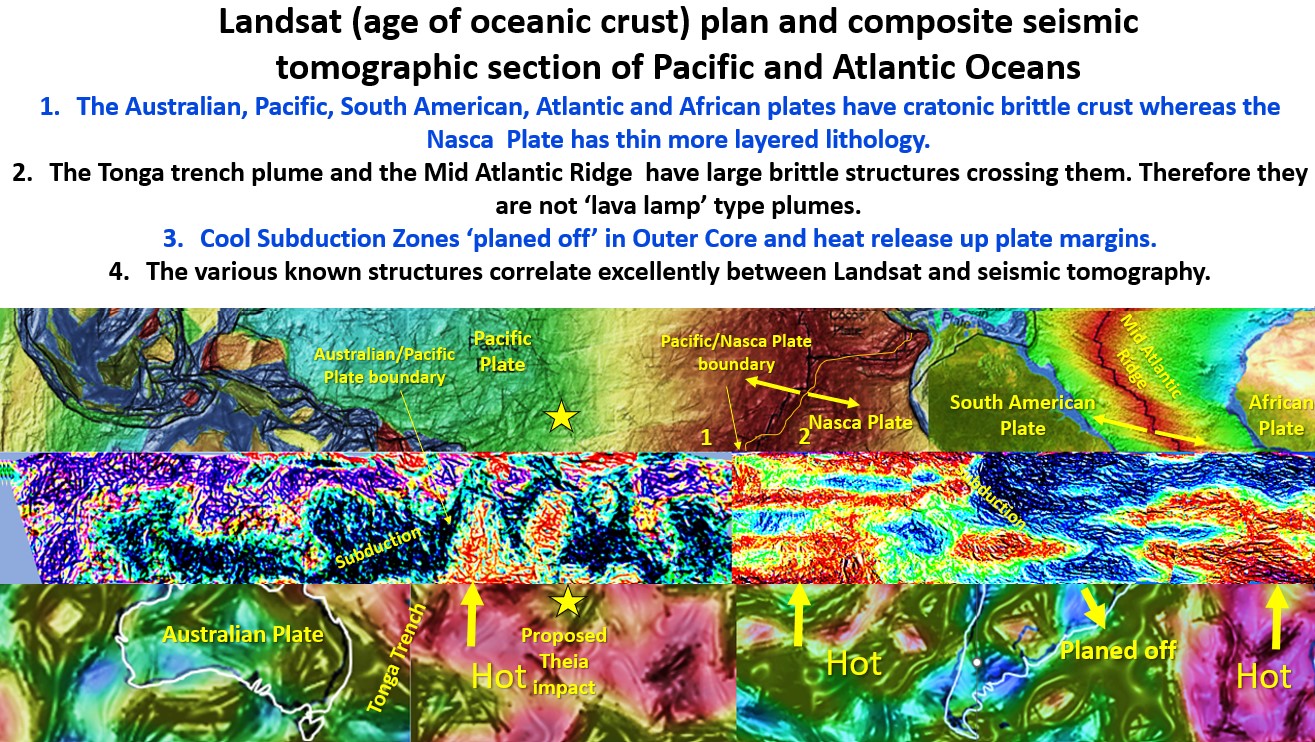
Figure 46. Landsat Plan and seismic tomography section of Pacific Ocean South America and Atlantic Ocean.

Earth Evolution, seismic tomographic from Tonga Trench through to West Africa (Part 13).

Figure 46. Landsat Plan and seismic tomography section of Pacific Ocean South America and Atlantic Ocean. This seismic section extends from the Tonga Trench (yellow star, proposed Theia impact site) … [Read More]

Like it? Share it!
Figure 43. Seismic tomography section from Sumatra to Nasca Plate with surface and 2775 plans.

Southern Hemisphere research from surface to core using Seismic Tomographic sections. Part 12.

In figure 40 (in part 11) we examined section M-N across Africa and noted that the lithosphere under Africa down to the Outer Core is brittle. Is this a one-off … [Read More]

Like it? Share it!