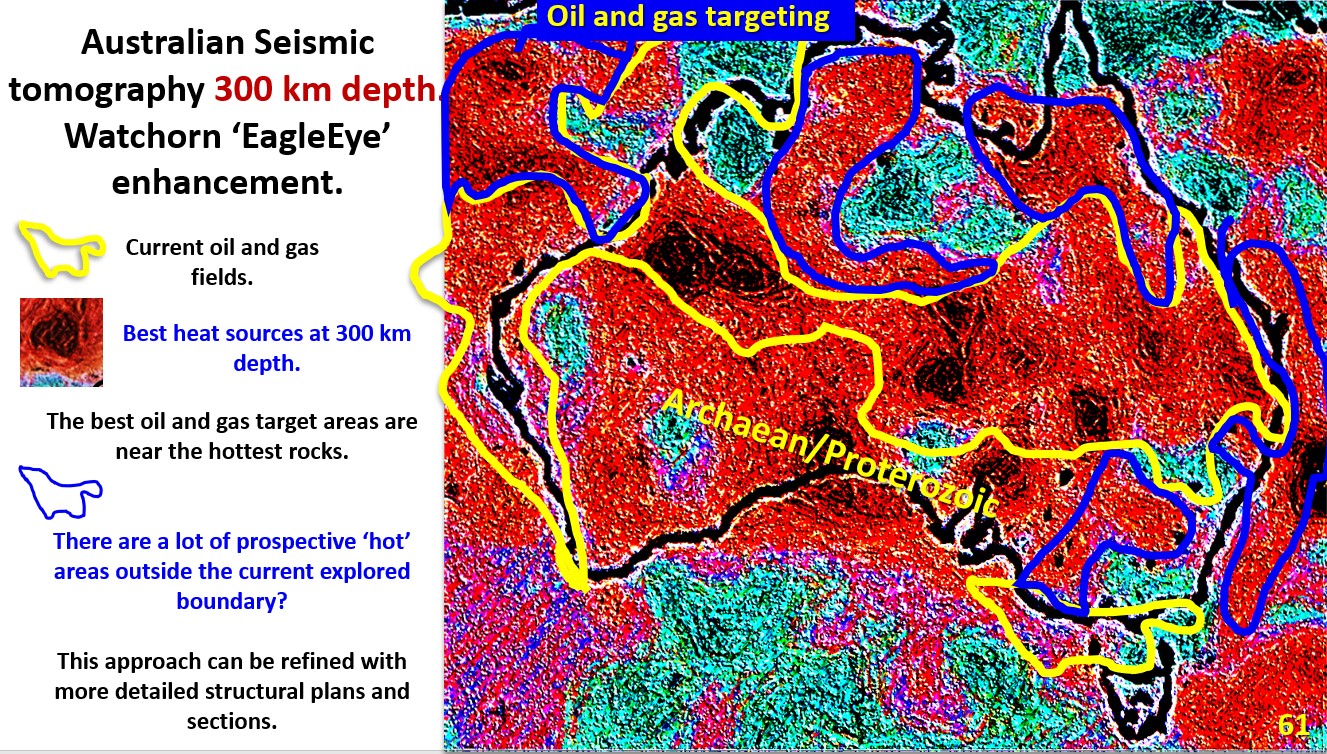
Figure 61. Australia EagleEye seismic tomography at 300 km oil gas targeting.

18.     Australian oil and gas formation and exploration targeting using seismic tomography at 300 km depth. (Part 22).

Figure 61 above. Australia EagleEye seismic tomography at 300 km, oil gas targeting. This figure is of the Australian seismic tomography at 300 km depth with Eagle eye enhancement. This … [Read More]

Like it? Share it!
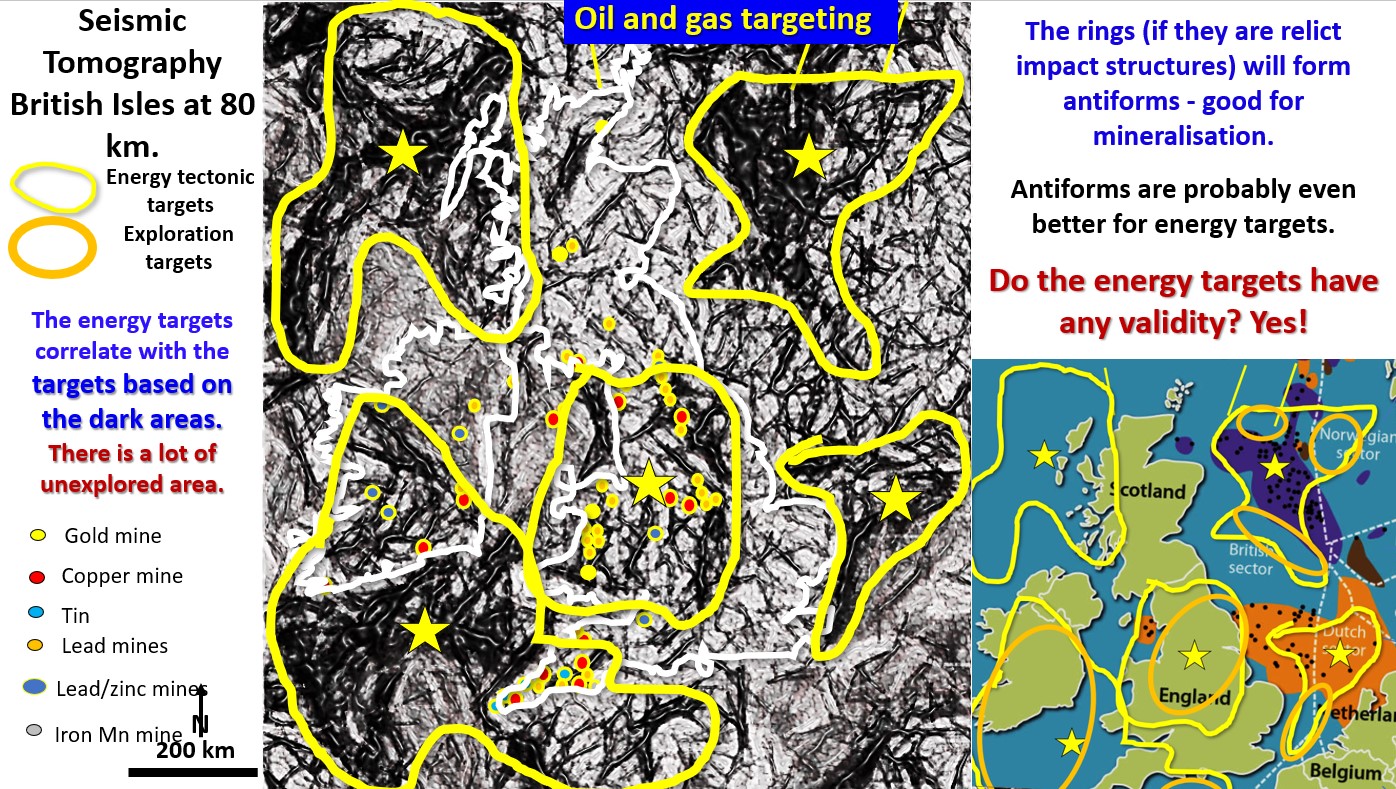
Figure 60. British Isles EagleEye seismic tomography at 80 km oil gas targeting.

17.     British Isles oil and gas formation and exploration targeting using seismic tomography at 80 km depth. (Part 21).

Figure 60 above. British Isles  EagleEye seismic tomography at 80 km oil gas targeting. The above figure shows the seismic tomography of the British Isles and the North Sea at … [Read More]

Like it? Share it!
Figure 52a. Goldstrike, Carlin, Bingham Canyon seismic tomography 300 km depth Edge.

Carlin Bingham Canyon area North America. Mineralisation and exploration targeting seismic tomography at 300 km depth. (Part 17).

Figure 52a. Carlin Bingham Canyon area interpreted, wormed seismic tomography at 300 km depth with mines overlain. This post details my gold copper exploration targeting in the Carlin/Bingham Canyon area. … [Read More]

Like it? Share it!