Figure 61. Australia EagleEye seismic tomography at 300 km oil gas targeting.

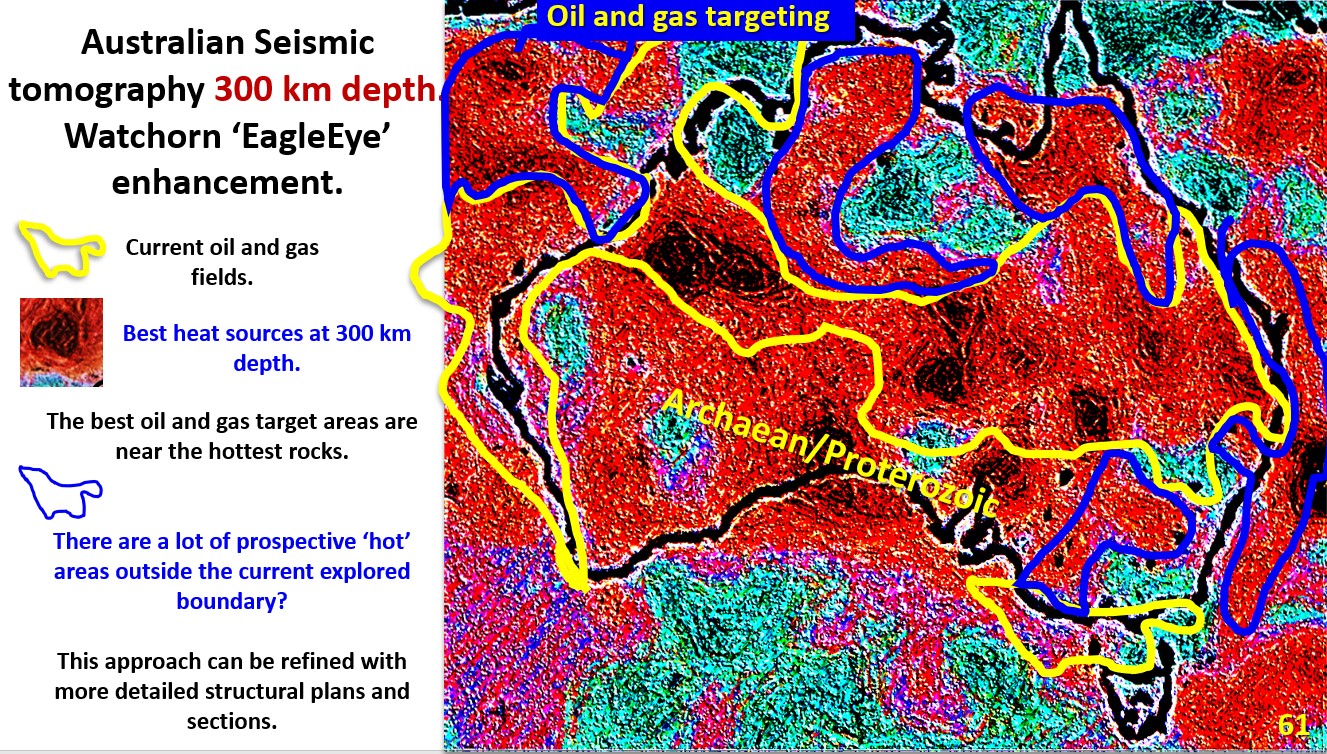
18.     Australian oil and gas formation and exploration targeting using seismic tomography at 300 km depth. (Part 22).

Figure 61 above. Australia EagleEye seismic tomography at 300 km, oil gas targeting. This figure is of the Australian seismic tomography at 300 km depth with Eagle eye enhancement. This … [Read More]

Like it? Share it!
Figure 58. North America EagleEye seismic tomography at 550 km with structure.

16.    North America tectonics of oil and gas formation and exploration targeting. (Part 20).

Figure 58. North America EagleEye seismic tomography at 550 km with structure. This plan is of North America seismic tomography at 550 km depth and shows high strain tectonic areas … [Read More]

Like it? Share it!
Figure 57. Global seismic tomography at 200 km depth showing Diamond exploration targets.

15. Diamond exploration targets using global seismic tomography at 200 km depth (Part 19).

Figure 57. Global seismic tomography at 200 km depth showing Diamond exploration targets. This post explains worldwide diamond distribution and suggests exploration targets based on that distribution. This figure shows … [Read More]

Like it? Share it!