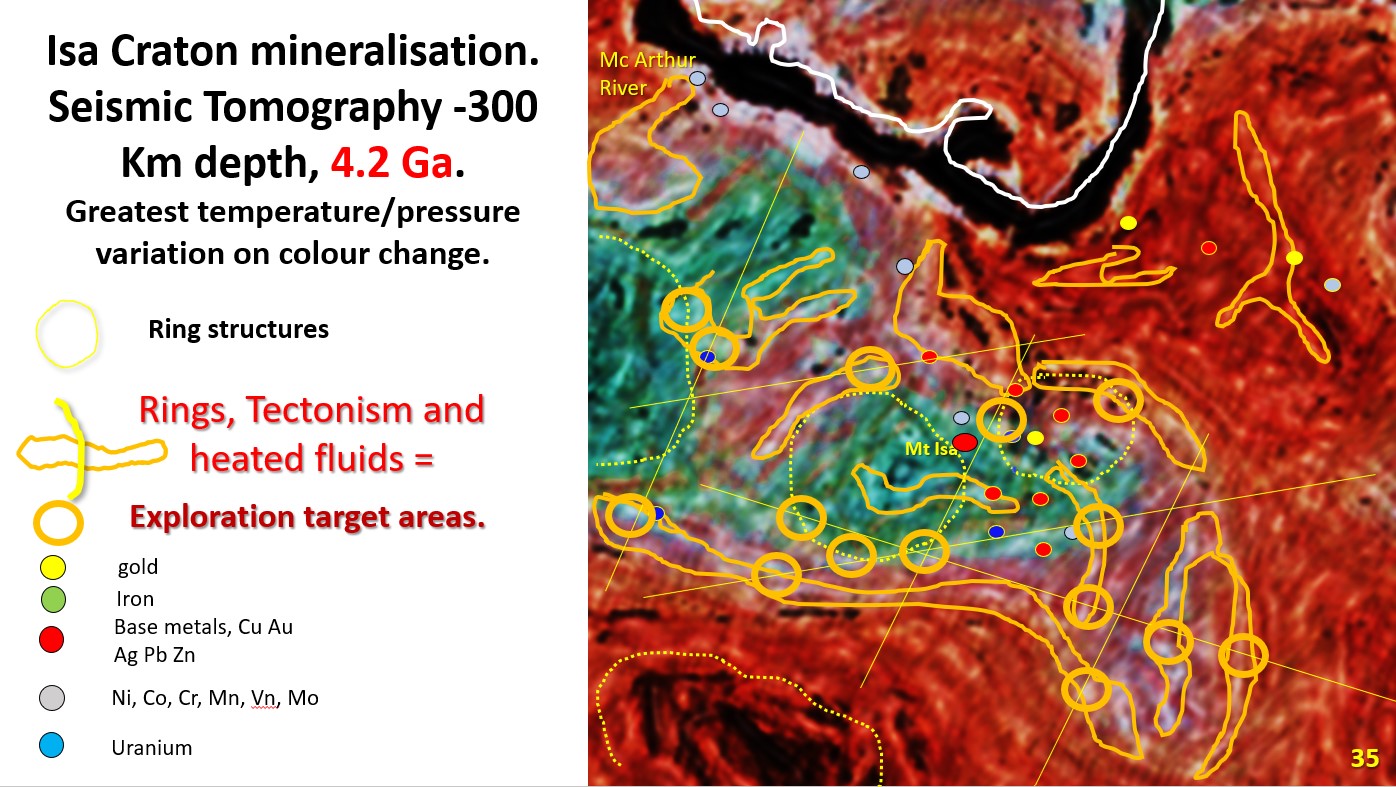
Figure 35. Isa Craton mineralisation and targeting. Seismic Tomography -300 Km depth.

11. Exploration targeting – Mt Isa craton, using Landsat and Seismic tomography at 300 km depth. (Part12.)

Figure 35 above. Isa Craton mineralisation and targeting. Seismic Tomography -300 Km depth.  Why are they specifically located here? What is special about the area that we can use for … [Read More]

Like it? Share it!
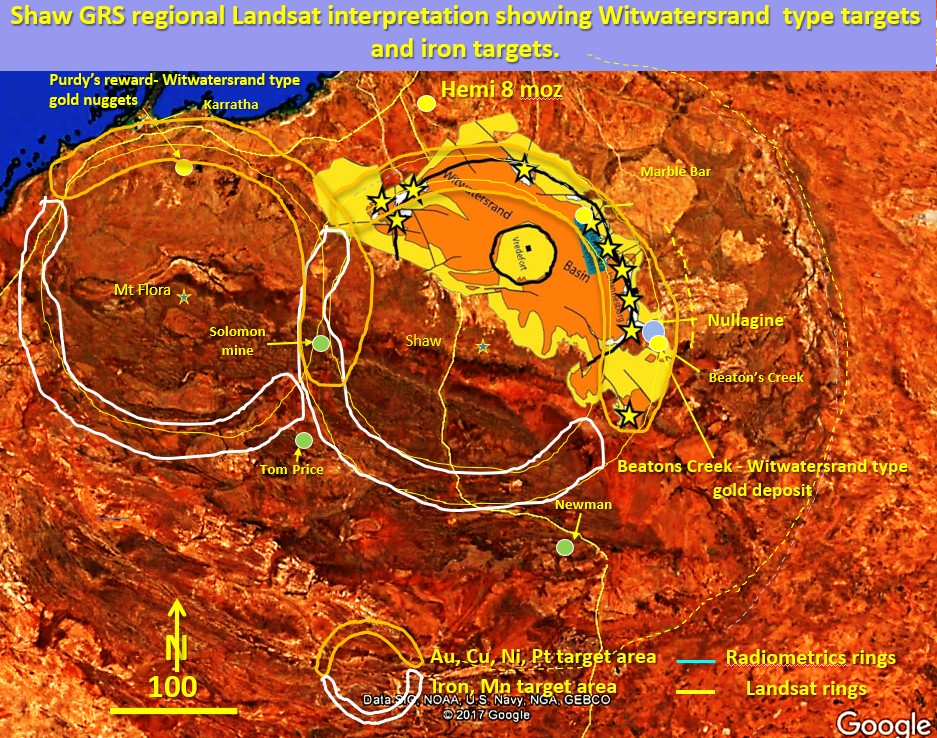
Figure 29. Pilbara Seismic tomography, 300 km depth.

10. Pilbara Craton structural geology, mineralisation and Exploration Targeting. Western Australia. (Part 10).

Figure 29 above. Pilbara Seismic tomography, 300 km depth. Geology and mineralisation, Exploration targeting based on maximum P/T gradient. This figure has had the high P/T boundaries marked out in … [Read More]

Like it? Share it!