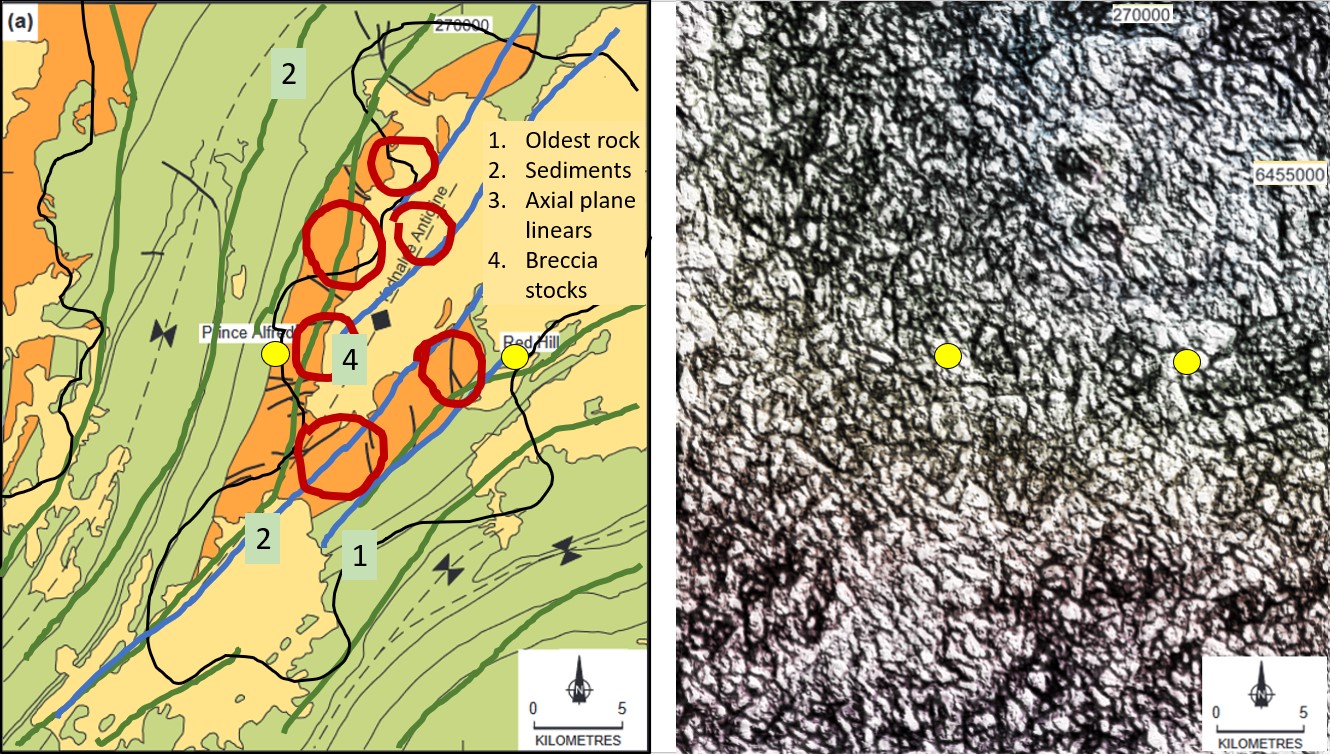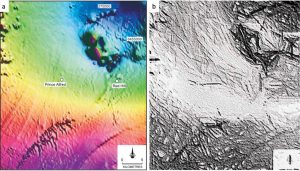
This post is in response to the following comment by Tobias Bamforth to another geoscientist on LinkedIn in my North American Structural geology post.
‘Lastly, I was wondering if you would like to attempt another explanation as to why the process might do something goofy like, I don’t know, turn all of the obvious N-S tending structures in a legitimate TMI image (Dentith and Stuart, 2003) into E-W trending structures?
Perhaps, the filter is following the direction of colour shading in a sketch-like fashion? Like it’s designed to do? And maybe, the light and dark areas ‘emphasised‘ by the ‘methodology’ simply reflect the light and dark colouration on an image, like greyscale effects are designed to do?
Rather than having anything to do with emphasising the ‘underlying’ linear features in an image?
There, I tried it on ‘relevant’ data. It still doesn’t work’. (see the above right side image)
This is a typical of the half tongue in cheek, half derogatory statements.
That post has had 11,400 visits by a total of 2,758 people consisting of,
- Geologist 551
- Exploration Geologist 205
- Geophysicist 114
- Exploration Manager 84
- Mine Geologist 68
- Managing Director 56
- Geoscientist 54
- Professor 46
- Others 1,580
So, many top ranking scientists are looking at the banter that goes on here and making judgements on those who make them!
‘Thinking’ geoscientists must wonder at the direction we are taking – or not taking!
When I see such an ‘amateurish’ attempt at trying to use my EagleEye system and then rubbishing the whole EagleEye system because the beginner couldn’t get it to work I thought I’d better show Tobias and the other 2,758 visitors what a wrong assumption this is 🙂
This attitude is a bit akin to me putting some apatite in a pressure cooker, putting it on the kitchen stove and then complaining that it didn’t give the right results of the which Tobias is studying in his PhD thesis. Worse still would be to say that his concept is flawed based on my ineptitude 🙂 😉
Just as an aside, I love these discussions as it gets me off my (a—) more routine research, and makes me prove to all what I have achieved – for that THANKS TOBIAS!
For those interested in some background on my North American structural geology post (and the interesting comments) here is the linkhttps://www.linkedin.com/in/bob-watchorn-97b95624/recent-activity/shares/#. The North American structural geology video is on https://www.youtube.com/watch?v=MtzmRbDw73w1w (edited) 6/5/22. This video is well worth a look at if you want some ‘out of the box’, paradigm changing geology! My website geotreks.com.au has many such papers including about 14 on North American geology and exploration targeting.
So keep in mind Tobias’s EagleEye attempt as you compare it with the ‘professional’ use of the EagleEye system to produce ‘real’ structural geology. This geology can (and will) be evaluated against the known geology to the extent that a provisional regional deformation system can be suggested using the detailed data.
I am writing this post as a teaching lesson. I’ve found that the general geologists’ knowledge of how to obtain, read and use structural geology is rudimentary. Unfortunately, it is a skill mainly learned by long practice, acute observation skills and the technical know-how of how to put it all together. Maybe ‘novices’ will learn a bit from this post 🙂
I started in 1968 and am still leaning – and still enjoying it and smiling!
The first image is my interpretation of the Dentith and Stuart 2003 TMI image. The following images step through the proposed deformation system and at the end the results will be compared with the known geology from Dentith and Stuart 2003, figures 2 and 12 (https://doi.org/10.1071/ASEGSpec12_14).
The geology plan on Dentith and Stuart 2003 can be cross checked as you proceed, for correlation.
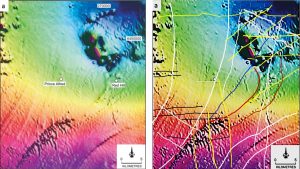
This is a slightly enhanced TMI image that I have used as a base interpretation for the EagleEye enhancement process. I always do this step before enhancing so that I have good geophysically based guidelines as to what structures I expect to find. This is standard, essential practice.
To get s structural deformation sequence from very complex geology we need to break it down into ‘bite sized’ chunks.
First noted were;
Two sweeping arcs of stratigraphy that extend from the SW corner to the top left and another to the middle right of the image.
The centre between these arcs is of higher, more complex magnetics.
There are NS, NW, EW and ENE linears.
The object of this structural geology exercise is to unravel these structures and lithologies and for that we will need much more detail.
I do add that this detailed structural geology cannot be obtained by current classical geophysical methods using these type of TMI plans.
I find this extremely surprising, and disturbing, as the medical industry can get beautiful, real time usable MRI and 3D ultrasound images (that put mine to shame) from very similar starting data. Why is the geoscience industry 30 years behind? Obtain and adapt their software guys – simple????
So here we go!!
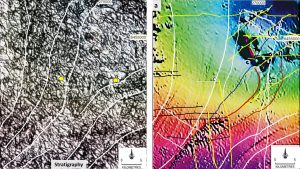
The left image took me about 25 minutes to get. There are many iterations (and much learning) needed to get a good image without the artifacts that plagued Tobias’s image. I’m not saying my image is artifact free. However it would be a brave geophysicist who would say that any geophysical image they produce is artifact free.
That’s part of the learning, and skill – to be able to recognise artifacts and minimise them. That is why I try to do a reasonable interpretation of the starter image first.
The starter image has a very strong magnetic contrast and (because of this) big zones of structurally blank areas. The first objective of any enhancement system is to get rid of the local and regional gradient and to get as much of this ‘blank’ structural data as possible on the one image. I have discovered a good way to achieve this and have explained it in my EagleEye notes on my website – or on LinkedIn – somewhere :>
Thus, the EagleEye image is not now a magnetic image but a detailed ‘topographical’ image of the fine changes in magnetic intensity. A completely different beast!
Therefore, the stratigraphy seen in the EagleEye image is much more complex but follows the same trends. The complexity is because of all of the extra structural data now on the image. To simplify this complexity it is a matter of domaining ‘like areas’ and then defining linears and ring structures – if they exist.
So far we have stratigraphy! What else is seen?
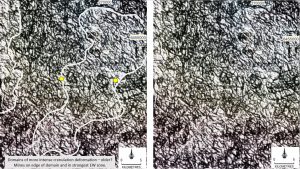
There are two domains – the relatively straightforward sediments and another two areas of much more complex structural geology.
These two areas are outlined above. The NNE trending central domain has complex EW, NNW, NNE, NW and NE trending linears and what looks like crenulation structures formed by these structures.
The sediments, in contrast, do not have this complex crenulation-like folding. Generally, the older a rock the more complex the structural geology. So, I would suggest this is the core of the structure. An antiform rather than a synform.
In fact the whole area reminds me of my 1982 MSc Stawell area in Victoria where a NNW trending antiform was flanked by younger less deformed and altered sediments. This is a mirror image trending NNE. Same age rocks too! This Stawell domal antiform core also had strong crenulation cleavage determined by similar linear structures. That was where the gold was!
The main objective of my research is exploration targeting! The rest is just fun on the side.
Complexly folded lithology is also observed down the left side which is similar to the central antiform. Thus if this is another antiform then the area in between, where the sediments are, is a synform.
So the evolution of the area so far is;
1. Two older complexly folded (or altered) antiformal cores.
2. Sediments forming synforms either side of these antiforms.
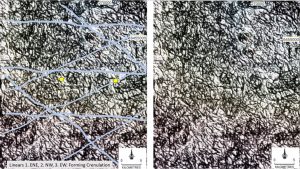
Next we need to see what structures cut right across the above two lithologies. By the rule of superposition these are later. Their fabric and interaction will determine their order of formation.
So the plan doesn’t get too busy I’ve only outlined the major sets of NW, ENE and EW linears.
The main geology lesson that these linears tells us is, that they are linears and are therefore later! The core and the flanking sediments exhibited complex non-linear geology.
My examination of the three chosen linears gives this order of formation (examine right side plan).
a. ENE oldest, wavy, irregular.
b. NW sharper, stronger, less overprinted.
c. EW long duration, from oldest (forming the crenulations) to youngest, sharp, dark linears in the central area. Note that the two mines straddle these EW linears! This is true in about 80% of the mines I’ve worked at and researched.
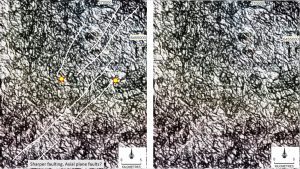
There is another set of linears that are very interesting. They follow the axial plane of the suggested antiform. They may be axial plane linears suggesting that the antiform formed late in the evolution of the area. They are dextral (right side towards you) in their displacement of the crenulation structures in the top right of the image. The Stawell folding was also dextral.
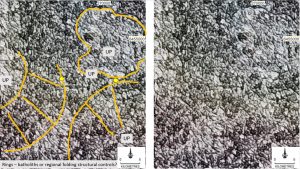
Aha! Now we get into the more controversial areas 🙂
My contention is that because I have proved that the linear structures produced by EagleEye can generally be proved to be reflecting real structures then we shouldn’t rationally be able to pick and choose other structures, as not real, unless they are clearly artifacts of processing. The above ring and arc structures are just as real as the structures defining the sediments and antiforms and the linears.
There is a big hangup on ring structures. I must admit there are many more ring structures accepted now than 20 years ago. They are an integral part of the geological (universe) story.
In this area I suggest the rings represent batholiths, stocks, bosses and maybe even salt diapirs (literature research)? Maybe even just large areas of hot fluid flow demagnetising the country.
The two lower partial ring/arcs shown are perhaps the aureole around large batholiths? The amoeboid collection of overlapping rings in the top right are located in the most complex geological area and also the area with the highest magnetics. I suggest this is a deep feeder zone for multiple stocks of about 5-10 km diameter.
If these rings and arcs represent upward flowing material (magma, granite, hydrothermal fluid, salt) then this will affect the pre-existing folds. They would form the domal area to the north and centre and squeeze the synforms in the south – each side of the antiform (see UPs on plan).
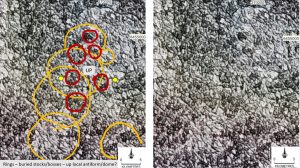
Using the same image a set of two later sets of rings can be observed. The large (10 – 20 km lighter coloured) set may be batholiths and the smaller (3 – 5 km darker coloured) set may be breccia pipes??
Because the plan only represents the geological boundaries and not the magnetic value of the rocks the darker the rock the more complex the structure. Thus the dark rings could be breccias as it doesn’t get much more complex than breccia 🙂
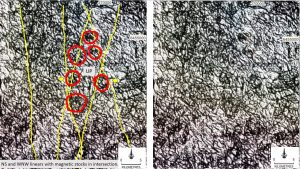
This plan shows strong, late (but segmented) NS, NNW and NNE linears and their relationship to the ‘breccia pipes’. These linears (and the EW linears) are the last major structures in the area. The breccia pipes area is closely associated with the intersection of all of these linears and also with the central area of the suggested antiform.
This is strong evidence that my sequence may be correct as that is exactly what happens in many parts of the world in mineralised terrains. Note that the two mines are closely correlated with the outside of these structures and the boundary of the older complexly folded rock with the less complex sediments.
This is the area of most competency, chemical and fluid flow contrast. This is exactly what Stawell looks like! It provides a good springboard for exploration targeting!
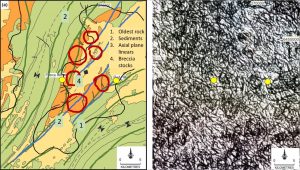
This final compilation is the main structural evolution features placed on the geology plan from Dentith and Stuart 2003. There is good correlation of these features with the accepted geology.
However, I will not be hesitant in saying that there is several orders of magnitude more (mostly acceptable) detailed geology on this plan than has been observed in this area. And this ultra-detailed geology has been obtained from a ordinary fuzzy TMI plan. It would form a fantastic platform for field geological work and geophysical area and methodology planning!
Conclusions
1. EagleEye has a lot to offer those who want to get detailed geology that cannot be currently got, even with the best geophysical plans available. Especially for those who need it for detailed exploration planning and targeting.
2. When will the geoscience industry accept that this structural geology is real and try to develop software to do the same tasks more effectively. Medical imaging can do it with MRI and ultrasound, Forensics can do it getting incredible detail from fuzzy images, NASA can do it reading newspapers from space, Eagles can do it spotting a rabbit from 2 km away. Bob Watchorn can do it with PowerPoint EagleEye, Hubble can do it with dithering. When oh when??
Cheers
Bob

