See the Webinar on North America at
https://www.ausimm.com/videos/community-event/south-west-wageoscience-society—digital-tech-talk-new-discoveries-in-the-structural-geology-mineralization–exploration-targeting-of-north-america/

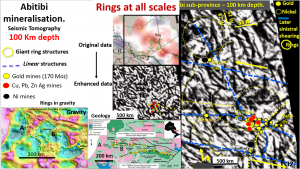
This slide shows the Abitibi belt in Canada on which I did some work about seven years ago. I’ll update that work in this talk. The Abitibi belt is one of North America’s largest producers of gold, copper, silver lead zinc and nickel. It would be fantastic to find a new one!
So, the aim of this exercise is to try and define areas in which to explore, based on sound structural geology evidence.
The gravity plan on the left (Peschler et al., 2006.) shows rings near the surface in the Abitibi belt.
I have found elsewhere that the mines are more associated with deeper rings and structures than those on the surface. Therefore, I used seismic tomography at 100 km depth to see if there were ring structures in another dataset. Rings were quite visible.
At 100 km depth there is a 1,500 km diameter ring to the NW of the Abitibi belt with smaller 500 km diameter rings encompassing the Abitibi belt. The Abitibi belt is in the SE quadrant of the big ring structure and is mainly associated with WNW and NE linears.
The Abitibi belt runs EW and there are strong EW structures seem at this 100 km depth in the seismic tomography.

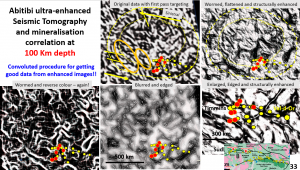
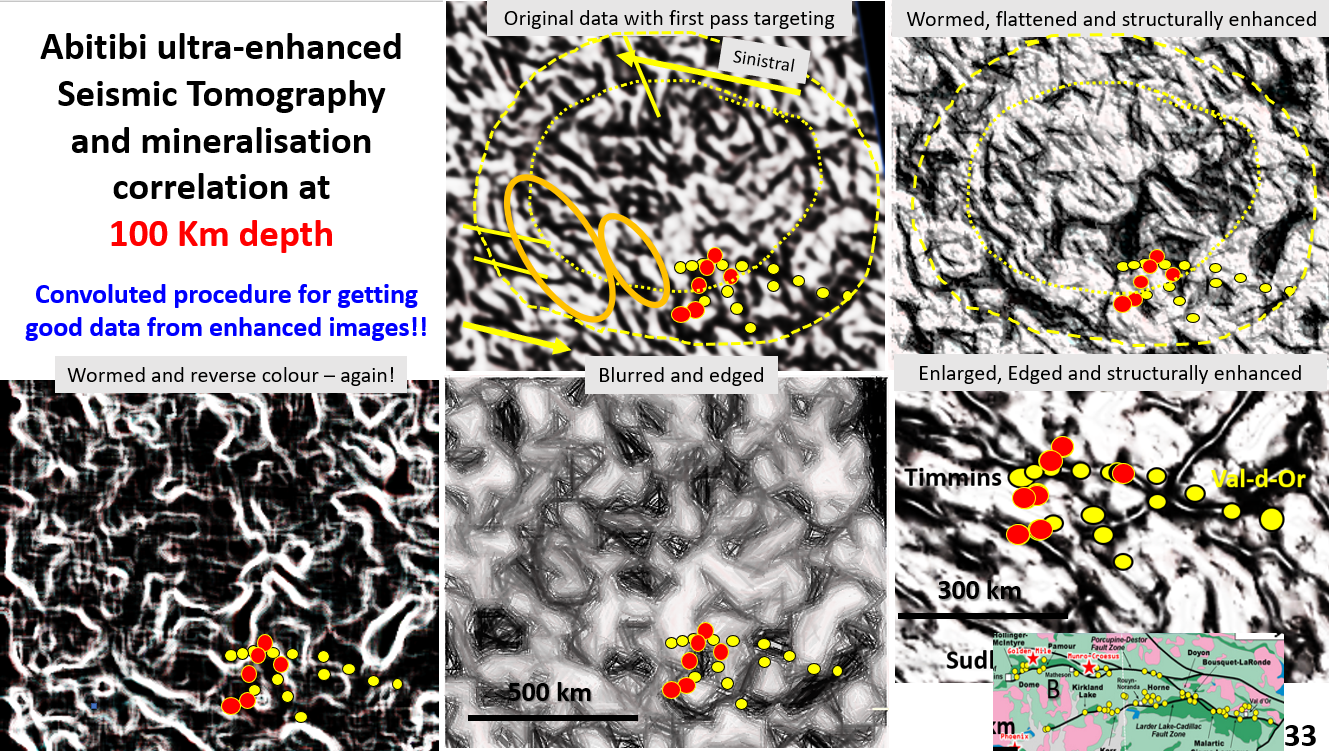
This set of five slides shows different, progressive enhancements carried out on the Abitibi belt.
First slide is the slide from seven years ago where I found the tomographic ring structure correlation with the Abitibi belt. The orange ellipses to the west are structural geology areas that I would be exploring given the right surface geological conditions. Can we improve on this for exploring on the more local scale?
Top right-slide shows an enhancement which highlights the large ring structure better but doesn’t really assist exploration targeting.
The bottom-left slide is what I call wormed and the mines lie on the white worm-like structures.,This is exactly the same occurrence as the mines in Africa and South America that I have researched.
These worms if used in conjunction with the structural geology plans are a good broad-view exploration targeting system.
The lower-middle plan is a first pass at trying to get detailed structural geology from the seismic tomography. The result is midway between the original fuzzy image and the end result to the right.
The lower right-hand plan is the end product where good structural geology has been gained from the tomography at 100 km depth.
When the mines’ positions from the extreme lower-right insert of the mines’ surface positions is compared with the structural seismic tomography plan at 100 km depth it can be seen that the shear structures still lie directly under the mines and have a very similar configuration. This suggests the structures are vertical.
If this plan and the worm plan from the bottom left are used as an exploration targeting tool then one would follow the ring structure, on which the main mines are located, around to the WNW and ESE and follow the NE structures north and south.
The portion of the separate ring structure to the SW of the main field should be followed NW and SE. This is a start for exploration targeting.
Share this with your colleagues.
Happy hunting
Bob Watchorn

