This post is an analysis of the different methods of gaining detail from data.
The original data and description is from Dr. Naser Meqbel LinkedIn post below;
……. Dr. Naser Meqbel • 1st CEO at 3D Consulting-GEO GmbH; Researcher Fellow at National observatory of Brazil.
✔ The 3D model is obtained from ModEM/3D-Grid.
✔ The MT data are publicly available from IRIS website.
✔ The minerals points are obtained from U.S. Geological Survey (USGS)…….
Bob Watchorn description and comments.
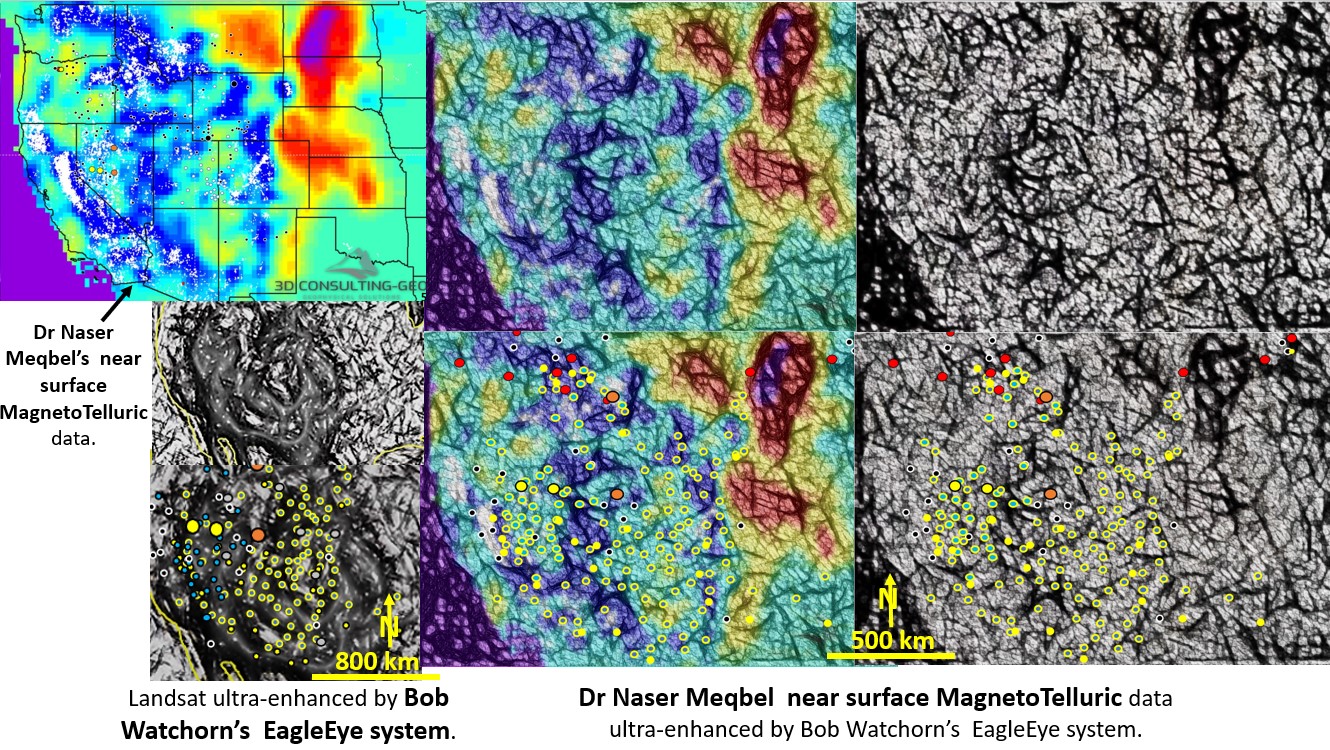
A structural evaluation, using my EagleEye method, of the Dr Naser Meqbel Image from the LinkedIn post of November 2021 was completed. I was interested to see if more structural geology detail could be gleaned from the Magnetotelluric image. I also compared the structural geology results with an ultra-enhanced Landsat image I completed a while back.
The seven image discoveries are as follows;
1. The original Magnetotelluric Meqbel image.
2. The original Magnetotelluric image overlying the structurally enhanced image.
3. The original Magnetotelluric image overlying the structurally enhanced image with the main mines overlaid. There is a series of overlapping large rings and NNW and ENE linears. The gold mines follow the dark blue higher resistivity areas and the uranium and silver lead zinc mines follow the moderate resistivity areas almost exclusively.
4. The structurally enhanced Magnetotelluric image with the main mines overlaid.
5. Structurally enhanced Magnetotelluric image to highlight the ring and linear structures. The gold mines follow the black higher resistivity areas and the uranium and silver lead zinc mines follow the moderate resistivity areas adjacent to the dark linears. What does this difference mean? It is definitely an exploration targeting criteria.
6. The ultra-enhanced Landsat image has very similar ring structures and linear directions to the Magnetotelluric image.
7. The mines follow the rings.

The six image discoveries are as follows;
8. The interpreted ultra-enhanced Landsat image has very similar ring structures and linear directions to the Magnetotelluric image.
9. Interpreted ultra-enhanced Landsat image with the main mines overlaid. There is a series of overlapping large rings and NNW and ENE linears. The mines follow the rings. The gold mines follow the dark resistivity areas and the uranium and silver lead zinc mines follow the lighter areas almost exclusively.
10. The Magnetotelluric image overlying the structurally enhanced image. A series of overlapping large rings and NNW and ENE linears is observed.
11. The original Magnetotelluric image overlying the structurally enhanced image with the main gold mining areas as shaded areas. There is a series of overlapping large rings and NNW and ENE linears. The gold mining areas follow the dark blue higher resistivity areas and have a good correlation with the rings, considering their overlapping nature and complexity.
12. Structurally enhanced Magnetotelluric image to highlight the ring and linear structures with interpreted rings and linears. There is a series of overlapping large rings and NNW and ENE linears.
13. Structurally enhanced Magnetotelluric image The gold mines follow the dark higher resistivity areas around the rings and the uranium and silver lead zinc mines follow the moderate resistivity areas adjacent to the dark rings and linears. What does this difference mean? It is definitely an exploration targeting criteria.


It is remarkable to see that the occurrences of Gold and Graphite are setting at the top of resistive structures.