We will now travel down to the Core/Mantle interface and compare the geological structures there with the location and geology of the surface continents.
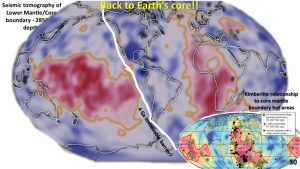
This image of the seismic tomography of the surface of the earth’s core at 2,850 km depth (Mingming Li et al., 2017) shows the seismic tomography characteristics of the lithologies on the surface of the earth’s core. The red is ultra-low velocity zones from higher than average heat sources. Why are these heat sources localised?
The inset in the bottom right shows the diamond kimberlite pipes in relation to the heat emanating from the core. Their correlation, in Africa, with the area of greatest heat supports my hypothesis that the majority of earth mineralisation emanates from the core-mantle boundary. The diamond pipes are located directly above the strongest heat sources in Africa suggesting that there is limited movement from the core to the surface in Africa.
This is in complete contrast to the Plate Tectonics theory which has the mobile mantle as a semifluid zone between the core and crust. If there was a mobile mantle beneath Africa then the diamond pipes would not correlate with the core heat source at all! This supports my observation that the lithosphere under Africa is rigid to the core.
The image will be enhanced to show the structural geology at 2850 km depth.
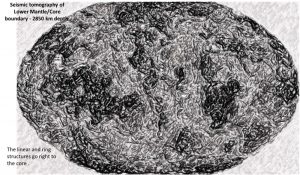
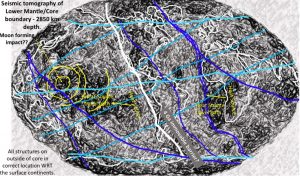
Linears and rings are clearly seen in this image.
This image of the seismic tomography of the surface of the earth’s core at 2,850 km depth (Mingming Li et al., 2017) has been enhanced to show mainly linear structures although many ring structures can be seen. The lithologies are fast (cratonic) over the whole region of North and South America at 2,850 km depth.
The first thing I noticed was that there was a strong NNW wavy linear extending from the top centre-left to the bottom centre-right.
This correlates with the huge NNW linear structure seen at 200 km depth that I called an immovable barrier. At 200 km depth there are 5,000 km diameter Hadean ring structures over this whole North and South America region which suggests that this region of the earth has not been very deformed over the last 4 billion years.
If this is the case then this NNW structure has formed an immovable barrier girdling the Earth from the surface to the outer core for this length of time.
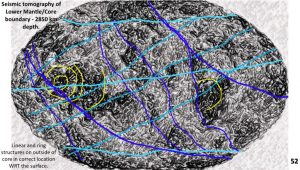
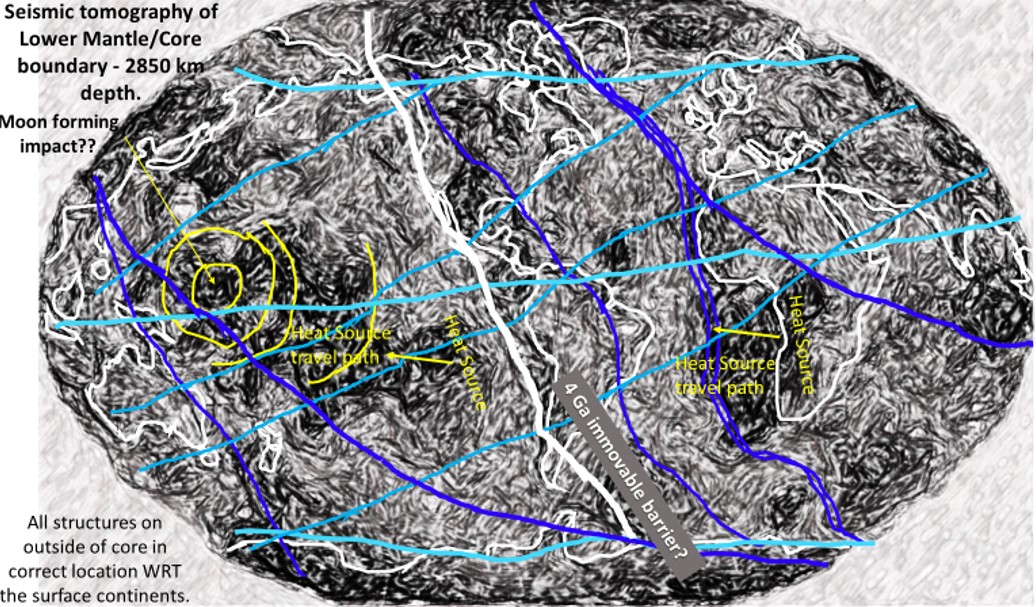
This figure shows the relationship of the linear and ring structures in the position where they sit above the core.
The huge ‘moon forming structure’ can be seen on the centre left on the core-mantle boundary and is in roughly the same position as in the 200 km depth tomography. This is still Earth’s largest heat source and probably drives the Pacific Plate Tectonism.
The African heat source is in a direct line to the east of the Pacific heat source. The two heat sources are separated by the strong NNW linear structures. I suggest that they form part of the same original heat source and that the Mid Atlantic Ridge has caused their separation. A lot more work is needed on this idea!
This figure shows the linear and ring structures in relationship to the continents in the position where they sit above the core.
The margins of the continents and the indentations often follow a WNW trend which is also the predominant trend seen on the core-mantle boundary further suggesting that many of the surface structures are related to these structures at 2850 km depth. In 1980 Tim O’Driscoll discovered these linears and called them Tethyn Twists.
Watchorn ‘working’ hypothesis on the Earth core to crust movement over the last 4 billion years.
An interesting observation about the Pacific heat source in this plan is that it is about 5,000 km further east at the core-mantle boundary then at 200 km depth. This is what would be expected with the eastward rotation of the core being marginally faster than at the lithosphere.
Of interest also is there is a strong correlation between the heat source on the core to the mid-Atlantic Ridge and the heat source under the Andes to the mid-Pacific Ridge. This suggests that the two main spreading ridges on Earth’s surface have their origin at the core. This is seen in the seismic tomographic transverse sections through Africa and South America.
However as previously noted the heat source under Africa appears to be directly under the heat source at 200 km depth and the diamond mines at the surface. This strongly suggests that the main driver for movement on Earth is the Pacific heat source.
The inference is that the Pacific is expanding and the rest of Earth is compressing to accommodate that expansion. The expanding Pacific Plates tries to push North and South America east (against the rotation of the Earth) with little success – hence the 4 billion year old immovable barrier and the huge subduction zones.
The western side of the Pacific ring of fire has more success pushing westwards (with the aid of the Earth’s rotational force) crumpling Asia and Africa. However, this movement almost ceases at Africa because the Atlantic/Africa heat source is trying to push Africa east and America west. Thus Africa and America have remained almost stationary only separating by less than 1000 km over the last 4 billion years (see posts on Africa).
We will examine this in greater detail when we look at the tomographic transverse sections on the next post.
If this paradigm changing ‘working’ hypothesis gets your geological juices active, makes your blood boil, or you can see obvious faults (pun) in it then please tell me and share it with your colleagues. We can all learn together!
Keep exploring!
Bob

