Note. The majority of this paper is a transcription from the video of the AusIMM Webinar at the Western Australian, South West Branch on the 30th July 2020. To view the video go to https://vimeo.com/464013825/1ed4a0c752 . Start listening at about 5 minutes in.
The language in this paper is thus vernacular and not geologese. This should make it more easily read and understood by the majority of readers.
Africa is a rich source of minerals. The main mining fields in Africa are located on the ring structures and linears from the surface right to the limits of detailed data at 400 km depth. The mechanism and source of the fluid for most mineralisation may have been discovered by this research.
This Part 6 section describes the relationship of the metal and diamond mineralisation to the linear and ring structures observed in African seismic tomography at 170-250 km depth.
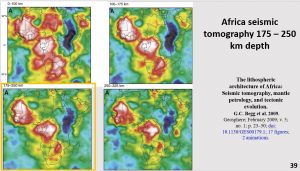
We will now look at the seismic tomography from 175 – 250 km depth.
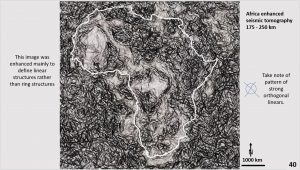
This image was enhanced to define detailed linear structures rather than ring structures. With the better dataset the structural geology is much more detailed (many thanks Graham and Co).
Very strong NNW linear structures trending from Gibraltar down to South Africa are observed and strong NNW linear structures also extend from Egypt and Saudi Arabia down through Madagascar.
The NE structures are less well-defined. We have seen in the cross sections that these are real structures, with NW structures dipping to the NE and NE structures dipping to the NW. The NE structures displace the NNW structures in Nigeria and Namibia and are therefore later.
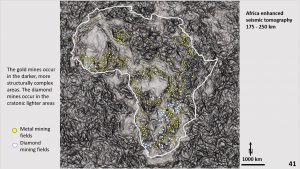
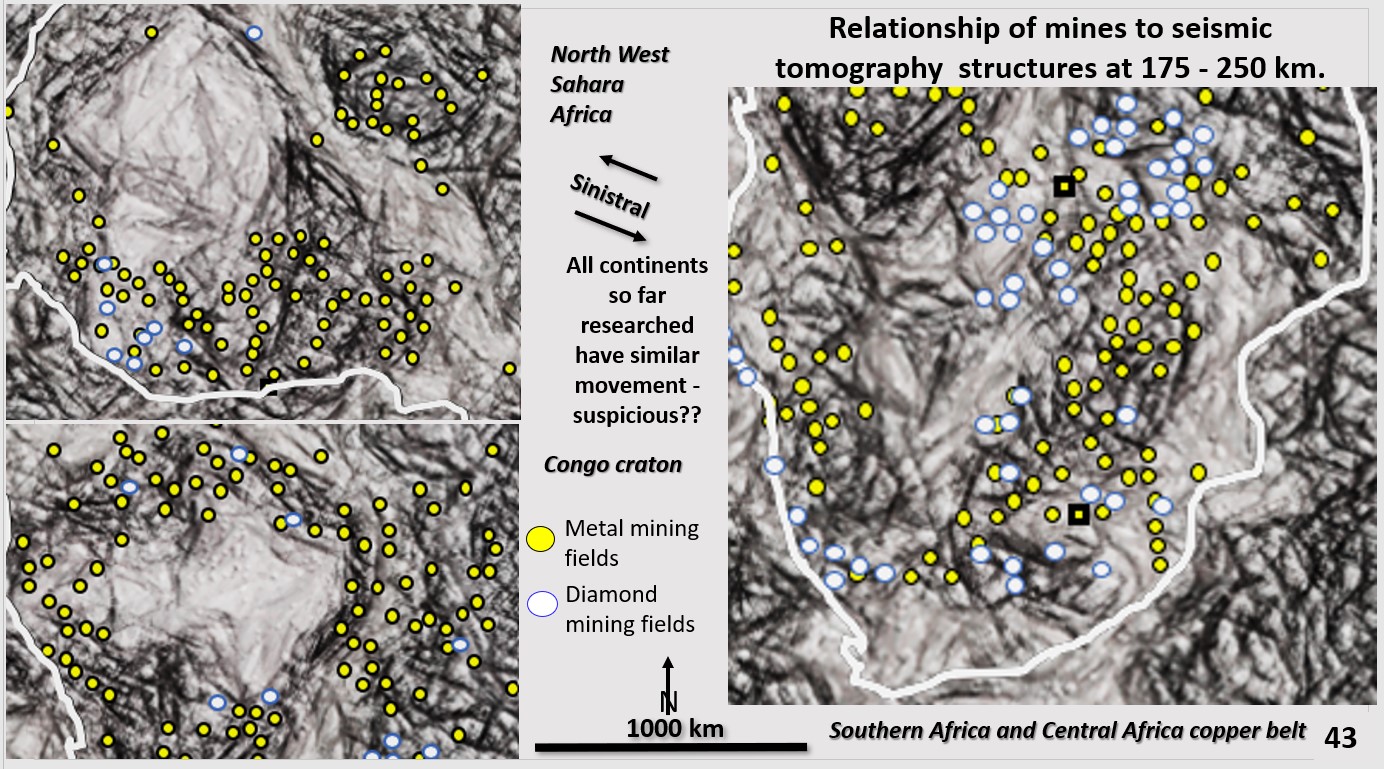
Plotting the mines over the ring and linear structures it can be seen that they are now following the structures much more closely than up at the 100 km depth.
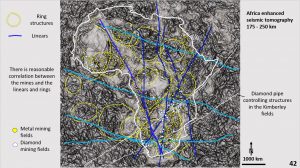
Plotting the ring and linear structures we can now start to define which ones control the position of the mines. The diamond mines in the Copper Belt and South Africa are located on ENE linears.
At this level the metal mines follow the dark contorted areas which are most likely seismically active and the diamond mines are located in the white stable cratons – why?
In all my research on the Australian,North America, East Asian, Eastern Europe, South America and now Africa all the structural movement in plan and section is SINISTRAL. Surely if the continents floated like skim on a swirling porridge, as depicted in current Plate Tectonic theory and videos, then the structural movements would be all over the compass. This needs investigation!!
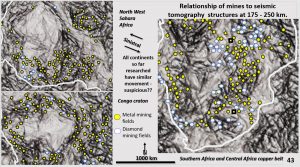
This image shows the position of the metal mines on the dark rings and linear structures more clearly. The diamond mines still sit on the white cratonic areas.
It was very difficult to get all these mines plotted as there is no single plan that has all these mines on it.
We will now compare the relationship of these mines to the ring and linear structures in Finland which I researched in paper https://www.geotreks.com.au/uncategorised/finland-seismic-tomography-mineralisation-exploration-finland/ .
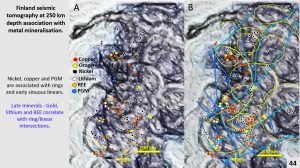
I did some research on Finland and the same pattern, at roughly the same depth, applied to the mines there also.
The nickel, copper and platinum group metals were associated with the rings and early sinuous linears and the gold mines and other late metals are associated mainly with the ring linear intersections.
Nickel mines lay within the rim of the rings and the gold mines lay on the rings and at the intersection of the rings. This is exactly how these minerals occur in Western Australia (Watchorn YW #8, 2019 figure 20, https://www.geotreks.com.au/work/giant-ring-structures/yilgarn-geology-tomography/ ).
There is a lot more to come on Africa and we will eventually get to the centre of the Earth – or at least to the upper core this trip 🙂 .
If you think this will help you with your geology research, enjoyment or mineral targeting tell me and most importantly – share it with your colleagues!!

